
The term "cone fundamentals" is a misnomer as developed within the psychophysical vision community. The suggestion is that the spectral responses measured by their protocols are fundamental to the cone type photoreceptors of human vision. In actuallity, the measured psychophysical responses are the cumulative response of the system. To understand the significance of this assertion, one must have a suitable schematic of the visual system (( Section 11.1.4)). The visual modality (like all sensory modalities) can be divided into five individual afferent stages.
In this figure, stage 4 involves high level signal manipulation prior to stage 5 cognition. Additional stage 3 signal projection circuits are also found between elements of stage 4 and stage 5. The following figure shows that the channels between the stages are multiple. The luminance (brightness) channel is labeled R. The two chrominance channels are labeled P and Q. Each of these channels modulates a separate stage 3 ganglion neuron.
It is critically important that steps be taken to insure only an individual absorption spectra is measured if that feature is the goal of the experiment.
The so-called cone fundamentals are perceptual responses evaluated at the output of stage 4 and incorporating the spectral responses of the stage 1 color chromophores and the temporal bandwidth of the stage 1 photoreceptors, the stage 2 signal processing and most importantly the stage 3 signal propagation circuits delivering the information to the CNS for final stage 4 processing and stage 5 cognition. It is the stage 3 signal propagation circuits that generate action potentials using an analog to phasic encoding scheme unique to the neural system (and seldom if ever used in man-made systems). It is the limited temporal bandwidth of the decoding circuits of stage 3 ( Section 14.3) that lead to the fusion of flickering images perceived by the brain. The stage 3 circuits also account for the deviation of the reported cone-fundamentals spectral characteristics from the intrinsic spectral characteristics of the chromophores of visual photoreceptors. The stage 3 chrominance circuits are asymmetrical and favor the M-channel over both the L- and S-channels.
The so-called cone fundamentals obtained by flicker photometry exhibit peak spectral wavelengths that are a function of the flicker frequency and the stimul intensity employed in their determination. Using long wavelength pairs and short wavelength pairs in separate flicker frequency experiments above a few Hertz result in double values for the M-channel cone fundamental. Any cone fundamental obtained by flicker photometry should be labeled with the flicker frequency at which it was obtained. As the flicker frequency approaches zero, the cone fundamentals exhibit peak wavelengths that diverge and fall into agreement with the theoretical chromophore spectral responses of human (and chordate) vision. The spectra obtained by using differential adaptation prior to stimulation, and long pulse stimulation (>150 msec), at the threshold level as a function of wavelength leads to the true spectra of the spectral channels.
Many methods of determining the individual absorption spectra of the visual system have been proposed and investigated. It is important that a method is selected that only evaluates the intensity distribution of the individual spectra and does not involve complex inter-relationships between the spectral channels. It is equally important that a method is selected that does not introduce limitations of the signaling channels beyond the photoreceptors.
In the prior figures, the brightness or R-channel of vision is encoded in stage 3 by an electrically unipolar technique with a threshold that is independent of the applied spectral wavelength (Section 14.3). Individual spectral channels can be isolated by differential adaptation that suppresses the unwanted channels. Adequate suppression of the M-channel requires 10-20 times more intense stimulation than the other channels. Optimally, a broad adaptation source with a wavelength extending from 440 nm to 500 nm should be used to isolate the L-channel. With adequate isolation, the measured L-channel spectra (both peak wavelength and spectra shape) will not vary with changes in the intensity of the adaptation source. To remain within the bandwidth of the stage 3 projection channel, stimuli of nominally 500 msec duration should be used. The measurement technique relies on the detection of a low level neural signal that is perceived to be colorless.
Both the P- and Q-channels in the prior figure are encoded in stage 3 by an electrically asymmetrical bipolar technique onto a nominally 30 pulse per second action potential carrier. While the technique does not involve a threshold, the perception of a color does depend on the precise electrical voltage recovered by the stage 3 decoders and presented to stage 4 for further processing. The recovery process employs a 3 Hz bandwidth low pass filter. For short duration stimuli (less than 150 msec), The number of action potentials delivered to the stage 3 decoding circuit for L-channel stimuli (and for S-channel stimuli in short wavelength pair experiments)is very small. As a result, the stage 3 decoders do not recover a faithful copy of the voltage presented to the stage 3 encoders by stage 2. The perceived color under these conditions does not represent the wavelength of the applied stimulus.
The most successful method of absorption spectra determination for the individual spectral channels in non-humans has employed electrophysiological techniques to measure the response of individual stage 1 photoreceptors to narrow spectral band stimulation using long pulse durations (nominally 500 nm). This method does not require differential adaptation of the retina since individual spectrally specific photoreceptors are probed. The technique does not involve the stage 3 signal projection circuits and does not involve perception by the brain of the subject. The opportunity of using this technique in humans is greatly restricted by medical ethics.
The most successful method of spectra determination for the individual spectral channels of human vision has employed differential adaptation (where the sensitivity of two channels is significantly suppressed in order to evaluate the third channel) followed by long pulse (typically 500 msec) stimulation using narrow spectral filters (nominally 10 nm) in a stairstep threshold protocol. The long pulses insure the perceived signal delivered by the R-channel to stage 4 of the brain has reached stability in the course of the measurement. The technique does not require the subject to perceive a color, only a threshold level signal.
One of the poorest methods of absorption spectra determination involves the use of sequential spectral stimuli matching in what is called flicker photometry (infrequently flicker colorimetry). The test is differential in character and involves pulse signaling through an asymmetrical stage 3 projection circuit that favors the M-channel over both the L- and S-channels. Limiting the flicker frequency to below 3 Hz insures flicker frequency independent results using this method.
The reported cone fundamentals have been acquired in the laboratory using the flicker photometry method at a typical flicker frequency of 17 Hz. This flicker frequency is approaching the critical achromatic flicker frequency (CFF) of the human visual system. This CFF varies between 5 and 40 Hz as a function of illumination for a achromatic stimulus and a 2 degree circular field centered on the point of fixation1. It is also approaching the chromatic flicker limit commonly defined by the critical color flicker frequency (CCFF). The CCFF is normally at a lower frequency than the CFF as shown by de Lange Dzn2. As noted by Wyszecki & Stiles (page 563) when discussing color flicker experiments, "At a very low rate of alternation, the observer will see a distinct repetitive change from the first color to the second and back to the first. With an increasing rate of alternation, the observer begins to see not only the two original colors, but also colors of intermediate hue, saturation and brightness; and when the rate is further increased, the two colors will fuse to a single color which is the color of the additive mixture of the two component stimuli.3"
The following figure summarizes the situation. It is plotted with the independent variable, flicker frequency plotted on the ordinate for consistency with other literature.
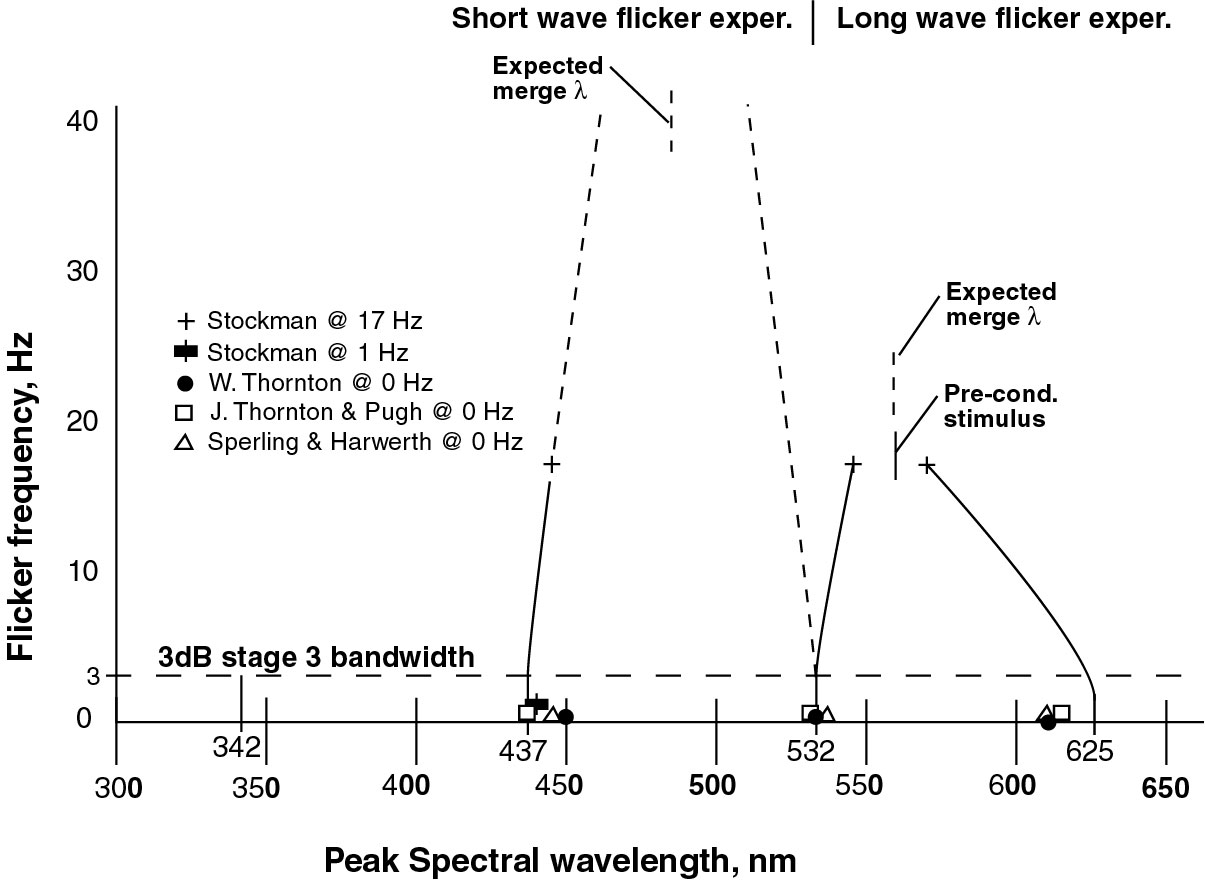
The figure shows the theoretical static peak spectral wavelengths of the chromophores of the photoreceptors of chordate vision on the abscissa at 342, 437, 532 and 625 nm. These peaks are calculated from the algebraic average of the short and long half amplitude spectral values of each of the chromophores (Section 5.5.10 ). These values are believed to be correct to within plus or minus 2 nanometers. Emanating from these theoretical values are a set of curves representing the peak wavelengths perceived by the brain at the output of the stage 3 signal projection circuits. These circuits introduce substantial limitations on the perceived color of flickering sources as developed in (Section 17.2.3)
The 1993 papers by Stockman, MacLeod & Johnson and Stockman, MacLeod & Lebrun of the Dept. of Psychology at the University of California, San Diego appear to have introduced the term cone fundamentals4,5. This work was a followon to the work generally assoiated with the Psychology Dept at the University of Chicago, Smith & Pokorny, Vos & Walraven and others. The Stockman, MacLeod & Johnson paper is extensive, includes a variety of assumptions and attempts to interpret their data relative to that of many other investigators. The microspectrophotometry (MSP) data and data from the suction electrode technique applied to the actual photoreceptors, which is the primary competition to their work was largely dismissed on page 2509, "The agreement between the human MSP data and our cone fundamentsls is notably poor, particularl for the M-cone data. Discrepancies of this magnitude suggest that MSP is of little value in defining cone spectral sensitivities." Although the Stockman, MacLeod & Lebrun paper discusses the signaling pathways of the visual modality concept, they offer no model or schematic of their assumed visual sensor modality.
The convergence of the M- and L- peak spectral responses observed by Stockman, MacLeod & Johnson at 17 Hertz agrees with the Stiles & Wyszecki quotation above. The two values are converging on their mean value near 560 nm. For an unexplained reason, Stockman, MacLeod et al. employed a preconditioning stimulus at this same wavelength.
The 1993 paper by Stockman, MacLeod & Lebrun used a flicker frequency method of spectral determination (up to 40 Hz) but they did not isolate the peak wavelength of the S-channel cone fundamental. Neither did they report on the M-channel peak wavelength. They indicated an inability to resolve the S-channel spectral peak at 40 Hz. As seen by the predicted (dashed) lines in the figure, the peak S-channel and M-channel spectral values would be expected to merge as suggested by Wyszecki & Stiles. This could have been awkward for the investigating team as the M-channel peak would have had different values for the long and short wave flicker experiments. In 2007, Stockman Langendorfer & Sharpe measured the peak S-channel cone fundamental at a lower 1 Hz flicker frequency and obtained a value of 440 nm at a coarseness of 5 nm6, close to the theoretical value of this work at 437 nm (see above figure).
The peak wavelength of the observed cone fundamentals are clearly a function of flicker frequency. The shape of the cone fundamental as a function of wavelength has not been rigorously, or theoretically, determined.
The theoretcial values shown above can be compared to the data obtained by a variety of investigators using long pulse or low frequency (below 5 Hz) flicker techniques. The values of these investigators generally fall along the curves shown within the gray box.
The best chordate data comes from Neumeyer & Arnold7. It shows the four spectral peaks, UV, S, M & L (labeled UV, X, Y & Z) associated with the retina of chordates unencumbered by a thick lens. Similar data is available from Douglas et al8. These data are discussed in (Section 5.5.10 )
The best human data, incorporating a thick absorptive lens, is from the two distinct Thorntons. J. Thornton & Pugh defined the peak spectral absorptions at approximately 430 nm, 530 nm and 615 nm based on a Maxwellian match approach and a limited view duration using a staircase technique9,10. A 10 degree diameter background was used at 6000 trolands. They show their data and some data from Vos (1978) on the same graph in the text article.
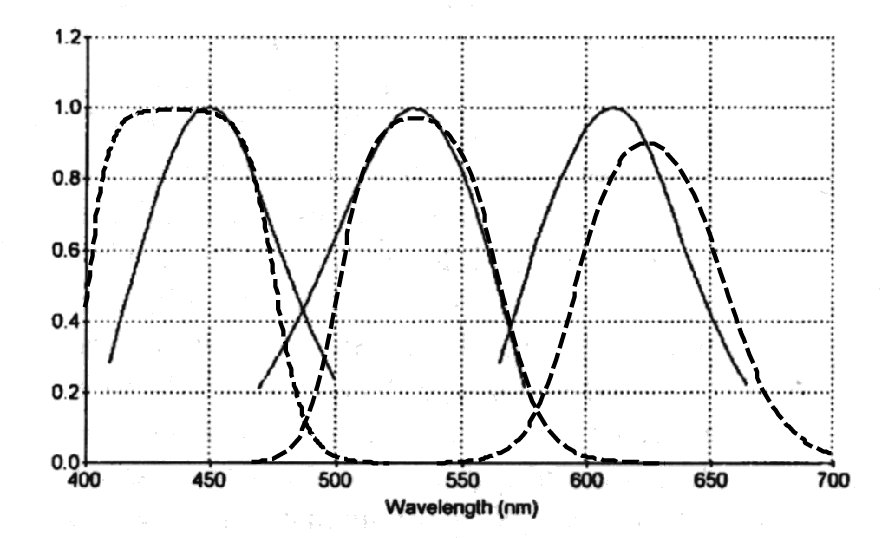
The following figure shows the measured spectral responses of the three chromophores of human vision reported by W. Thornton11 compared to the theoretical absorption spectra. W. Thornton used a split field Maxwellian match method which is nominally at zero flicker frequency. The measured short wavelength peak is impacted by the absorption of the human eye lens at wavelengths below 450 nm. The M-channel peak agrees very well with the theoretical peak at 532 nm. The measured long wavelength peak at 615 nm is very close to the theoretical peak at 625 nm.
Sperling & Harwerth used an incremental threshold technique to measure the spectral response of monkeys12. They showed peaks in their threshold spectra at 445, 535 to 540 and 610 nm. They recognized the conflict with the earlier work of Wald, based on Young-Helmholtz. They also compare their data to the Dartnall nomogram.
In their later work, Baylor et al. modified their suction pipette technique to employ axial stimulation. the result was spectra compatible with the theoretical spectral peaks suggested above.
Sperling & Harwerth, and others, have attempted to rationalize the observed peaks in the overall human absorption spectra (437, 532 & 610 nm) measured under static conditions with the "cone fundamentals" measured at a specific flicker frequency (535 & 575 @ 17 Hz). However, their discussions have generally been at the conceptual level. Sperling & Harwerth have provided a set of simple static equations to show the observed peak in the overall spectral responses of human vision, near 610 nm, can be developed from the linear difference between the peaks near 535 nm and near 575 nm measured at 17 Hz flicker. Unfortunately, as they noted, the spectral response of the presumed chromophore peaking at 575 nm does not correlate well with the Darnall nomograph for that wavelength. They do not provide a graphic describing the spectral response of their calculated absorption spectrum in the region of 610 nm.
The basic problem is that the peaks at 535 and 575 nm are functions of flicker frequency and not constants. Their difference does not give a consistent and appropriate absorption spectra peaking at 610 nm for various flicker frequencies.
As shown in the first figure, the peak wavelengths associated with the perceived cone fundamentals are a function of the flicker frequency. They are given by the peak theoretical spectral frequencies at 437, 532 and 625 nm multiplied by an appropriate function of flicker frequency.
The peak wavelengths of the cone fundamentals at zero flicker frequency are in excellent agreement with the peak wavelengths of the perceived peaks reported by multiple investigators and the theoretical values of the intrinsic absorption spectra of the chromophores (the Rhodonines) proposed in this work.
To achieve a good representation of the detailed overall human absorption spectra at threshold, it is necessary to employ the logaritmic summation of the absorption spectra of the three intrinsic spectral responses peaking at 437, 532 & 625 nm. This logarithmic summation accounts for the minor peaks observed in the region of 490 nm and 575 nm as recently confirmed by Babucke (Section 17.2.1 & 17.2.2). Meticulus care in protocol and test set design are required to achieve precise human absorption spectra. Subject to subject variations in macula absorption and body temperature become significant.
In 1990, Kalloniatis & Harwerth continued the earlier Sperling & Harwerth investigations but transitioned to a complex logaritmic approach (involving both the logarithm of a difference and the logarithm of the sum of the cone fundamentals spectra over indepenedent piece wise regions) from their previous linear assumption13. Their resultus provide a much better fit to the observed human threshold spectral absorption, but involve a less plausible neurological implementation, as also discussed in Section 17.2.2 of the above hyperlink.
The author welcomes and will respond to any comments or suggestions left at the comment page. Section numbers of the main manuscript, available on the web, are shown in brackets. The manuscript can provide more detail when desired. The first number shown is the chapter number; it is followed by the section numbers. Download individual chapters.
1 Hecht, S. & Verrijp, Shlaer, C. (1933) Intermitent stimulation by light. IV. A theoretical interpretation of the quantitative data of flicker J Gen Physiol vol 19, pp 266-286 Also reproduced in Wyszecki, G. & Stiles, W.(1982) Color Science, 2nd Ed. page558
2 de Lange Dzn, H. (1958) Research into the dynamic nature of the human fovea--> cortex systems with intermittent and modulated light J Opt Soc Am vol 48, pp 777-789
3 Wyszecki, G. & Stiles, W. (1982) Color Science, 2nd Ed. NY: John Wiley & Sons
4 Stockman, A. MacLeod, D. & Johnson. N. (1993) Spectral sensitivities of the human cones J Opt Soc Am A vol 10(12), PP 2491-2521
5 Stockman, A. MacLeod, D. & Lebrun, S. (1993) Faster than the eye can see: blue cones respond to rapid flicker J Opt Soc Am A. vol 10(6), pp 1396-1402
6 Stockman, A. Langendorfer, M. & Sharpe, L. (2007) Human short-wavelength-sensitive cone light adaptation J Vision vol 7(3), aritcle 4, pp 1-17
7Neumeyer, C. & Arnold, K. (1989) Tetrachromatic colour vision in goldfish Vision Res. vol. 29, pg. 1719-27
8Douglas, R. Bowmaker, J. & Kunz, Y. (1987) Ultraviolet vision in fish. In Kulikowski, J. Diskinson, C. & Murray, I. ed. Seeing Contour and Colour. NY: Pergamon Press, pp 601-616
9 Thornton, J. & Pugh, E. (1983) Hue cancellation and increment thresholds In Mollon, J. & Sharpe, L. eds Colour Vision NY: Academic Press pg 366
10 Thornton, J. & Pugh, E. (1983) Hue cancellation and increment thresholds Science vol 219(4581), pp 191-193
11 Thornton, W. (1999) Spectral sensitivities of the normal human visual system, color matching functions and their principles . . . . Color Res Appl vol 24(2), pp 139-156
12 Sperling, H. & Harwerth, R. (1971) Red-Green interactions in the incrementa-threshold spectral sensitivity of primates Science, vol 172, pp 180-184
13Kalloniatis, M. & Harwerth, R. (1990) Spectral sensitivity and adaptation characteristics of cone mechanisms under white-light adaptation JOSA A vol 7(10), pp 1912-1928