The published volume, "Hearing: A 21st Century Paradigm" presents a complete and contiguous description of the hearing modality of the neural system. Only a brief synopsis of the role of the cochlea within this modality will be presented to show how various oto acoustic emissions arise. Basically, treating the audio energy as
| Mechanism | Section in Chapter | page |
| 1. a surface acoustic wave | 4.1.5 | 119 |
| 2. traveling slowly (at about 6 m/s) | 4.3.3.5 | 150 |
| 3. along Hensen's stripe | 4.3.3 | 140 |
| 4. curled into a Hankel function | 4.3.3.2 | |
| 5. on the surface of Kimura's membrane | 4.3.3.2 | |
| 6. on the active liquid crystalline surface of the tectorial membrane | 4.3.3.5 | |
| 7. causing the energy to be dispersed at best freq. locations | 4.6.1 | |
| 8. employing the Marcatili Effect | 4.5 | |
| 9. to be intercepted by the appropriate groups of outer hair cells (OHC) | 4.6.1 | |
| 10 where it is transduced into an electrical neural signal | 5.2.3 |
pretty well tells the story of how the cochlea operates.
The details of these individual processes and structures have been explored in the paragraphs listed on the right as they appear in the published book "Hearing: A 21st Century Paradigm ." and available as individual chapters on line. The first digit in the section number indicates the chapter in which the citation is found.
A paper is available looking at the subject of otoacoustic emissions more explicitly. It begins with a chart of definitions. All otoacoustic emissions can be divided into those observed by the clinician and those perceived by the subject.
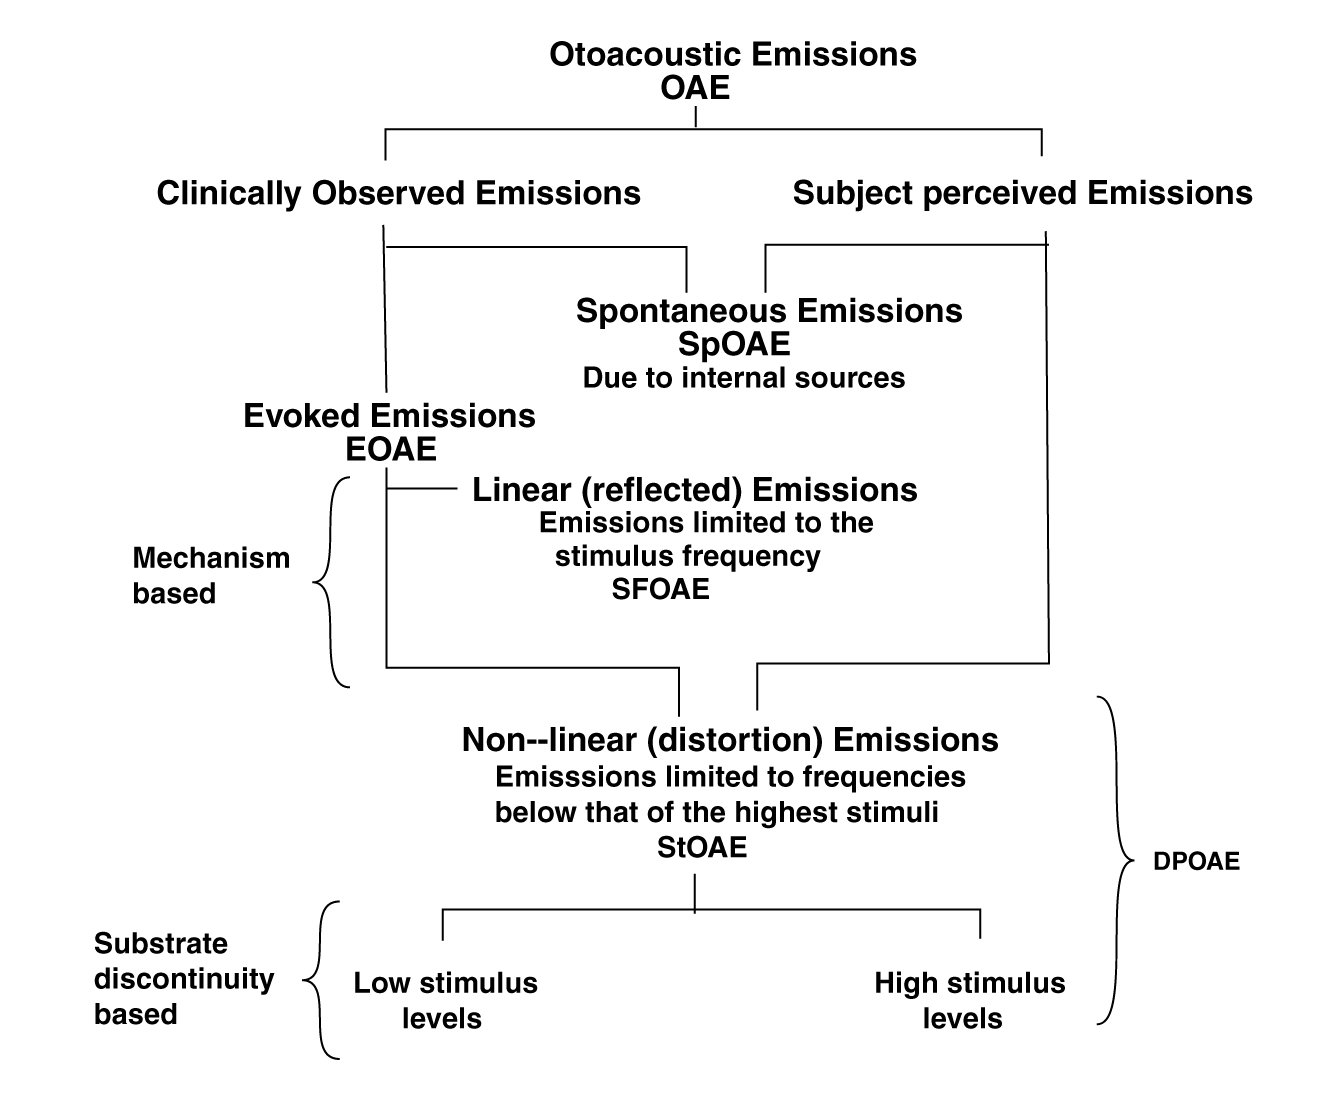
A rare but important type are the spontaneous otoacoustic emissions (SpOAE)observable by the clinician listening at the ear canal. Some of these are only observed by the clinician. Their existance is sometimes a surprise to the subject. Other SpOAE are reported by the subject but must be separated from similar sounds due to tinnitus. They may or may not be observable by the clinician.
Evoked otoacoustic emissions (EOAE) are caused by stimuli introduced into the ear canal, and generally are sensed by a microphone placed in the ear canal. They generally result from structural discontinuities located along Hensen's stripe within the cochlea. EOAE are of two major classes;
StOAE can be generated under two different conditions.
These disruptions can involve the complete cross-section of Hensen's stripe, or more commonly, involve the fillet region where Hensen's stripe blends into Kimura's membrane (the liquid crystalline layer on the surface of the Tectorial Membrane). The dark ovals in the following figure, from Section 9.11.3, shows the character of the disruption in the fillet region.
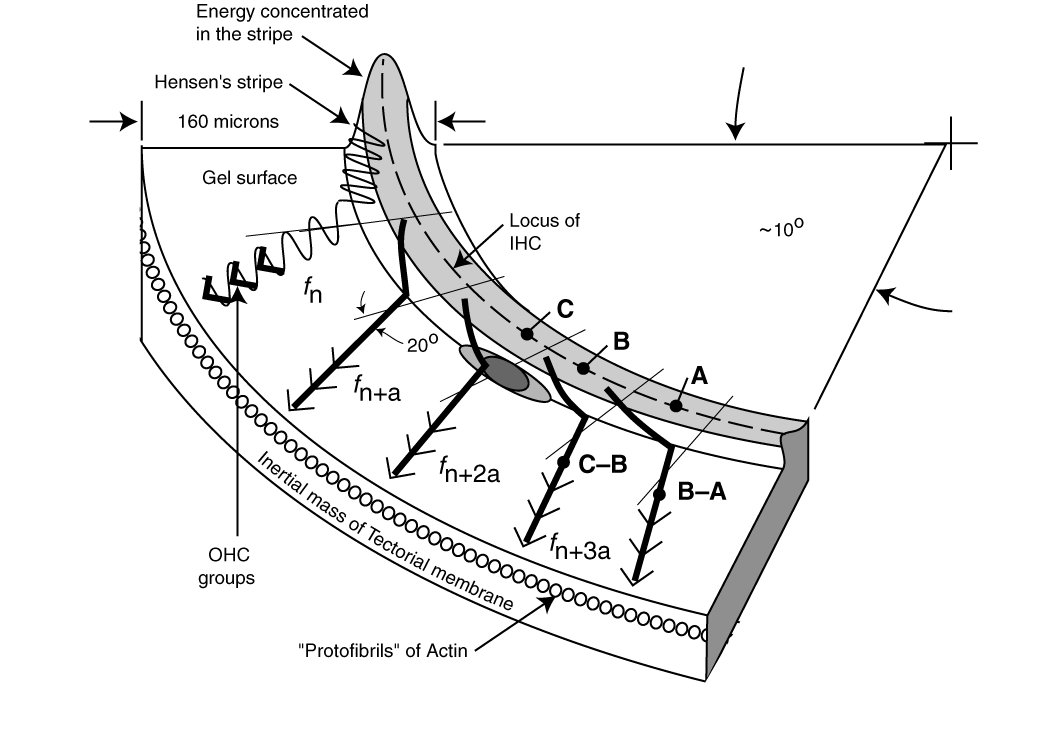
Under normal operation, a dsicontnuity in the fillet area occurs slightly beyond the "best frequency" with reference to the cilia of the IHC along the top of Hensen's stripe, and slightly before the "best frequency" location with reference to the cilia of the OHC out on Kimura's membrane. Note tha ability of energy at low frequency to pass by the fillet discontnituity (and allows the use of the cancellation method of determining the properties of some specific StOAE appearing at low frequencies.
A more significant discontinuity interrupting all of Hensen's stripe, prevents any energy from passing the discontinuity and leads to profound loss of hearing at frequencies below the best frequency location of the disruption.
By developing,
it describes the generation of all potential distortion product otoacoustic emissions (DPOAE) and a more limited set of DPOAE) that can be observed in the ear canal of various species of animals. The work also shows that a well known paper by Shera and Guinan (1999) used a formula (they described as simple) and a conceptual model that were too simple. Any discussion of DPOAE must recognize the finite velocity (speed) of the surface acoustic wave traveling along Hensen's stripe within the cochlea. The time delay associated with any round trip between the stimulation source within the ear canal, the point(s) of DPOAE creation, and back to a microphone in the ear canal is best represented by a total absolute phase, that is xxx times (the distance traveled divided by the velocity of the traveling wave).
Some of the StOAE are in a favored situation. Those at frequencies below that of the highest frequency stimulus have the opportunity of returning to Hensen's stripe and continuing to forward propagate as a slow Surface Acoustic Wave until they reach their best frequency location. At that point, they are dispersed to the OHC, are transduced and perceived by the subject. They also have the opportunity to return to Hensen's stripe and backward propagating to the vestibule, and eventually to the ear canal where they can be observed by the clinicial as DPOAE.
The cancellation method of DP characterization provided a validation of the primary method of DP geneeration proposed here, and provides a convenient method of determining the amplitude and phase of the low frequency DP's forward propagated and detected by the subject at the appropriate CF location.
The technique relies upon the ability of a low frequency tone to propagate along Hensen's stripe and to pass by the discontinuity generating DP's. This is particularly possible if the discontinuity is actually located at the fillet between the lower edge of Hensen's stripe and Kimura's membrane. The lower frequency tone continues to propagate along the upper extremes of Hensen's stripe unhindered. This propagating signal encounters no phase shift or other distortion due to the discontinuity.
At the CF of the low frequency DP of interest, the DP and the cancellation tone are both dispersed to the appropriate OHC in unison. If the cancellation tone is varied in both amplitude and phase to cause a complete cancellation in the perceived DP, the subject will not perceive the DP. The specific frequency and time delay associated with the CF loncation can be read from the cancellation tone generator.
Go to detailed discussion of otoacoustic emissions
Return to the hearing website home page.
See citations to the Chapters and Sections of this work in the opening section of this webpage.