|
| ... | Why no OAE at frequencies higher than F2? |
... |
In otoacoustic emission (OAE) testing, no distortion products appear at frequencies above the frequency, f2. This is true for the hearing modality in mammals, monotremes, birds and amphibians.
The 21st Century Paradigm of Hearing presented on this website explainS this situation unequivocally. This page will summarize why OAE do not occur at frequencies above f2.
Before addressing why no distortion products (DP's) are found in the ear canal at frequencies above f2, some
Background is probably required. If not, the reader can move directly to the
Discussion.
During the 20th Century, a great amount of academic time was spent attempting to explain the operation of the Organ of Corti within the cochlea based on the accessibility of the basilar membrane. The result was a large but conflicting database with no available theory explaining it. With newer, more precise knowledge and techniques, it is now possible to provide a contiguous description of the hearing modality from the ear canal to the neural system of the Central Nervous System.
The following figure shows a schematic of the operation of the modality from the ear canal through the cochlea.
The energy arrives at the tympanic membrane (the ear drum) traveling in air at 340 meters/sec. It is applied to the vestibule of the labyrinth (which icludes the cochlea) through the levers of the middle ear where it is translated into a compression wave within the fluid of the vestibule traveling at 1500 meters/sec. The challenge is to slow the propagating energy down to a practical value. The feature known in the surgical field as the cul de sac of the cochlear duct is responsible for this process. It converts the acoustic energy into a surface acoustic wave (a slow traveling wave) propagating at only 6 meters/sec. How this is accomplished is described in detail in Section 4.4 & 4.5 of the book, Hearing: A 21st Century Paradigm available in electronic or printed form from this site. Chapter 4 can also be downloaded separately. As a result, the energy is found to be traveling along the active surface of the tectorial membrane within the cochlear duct (a.k.a. the scala media in academic research).
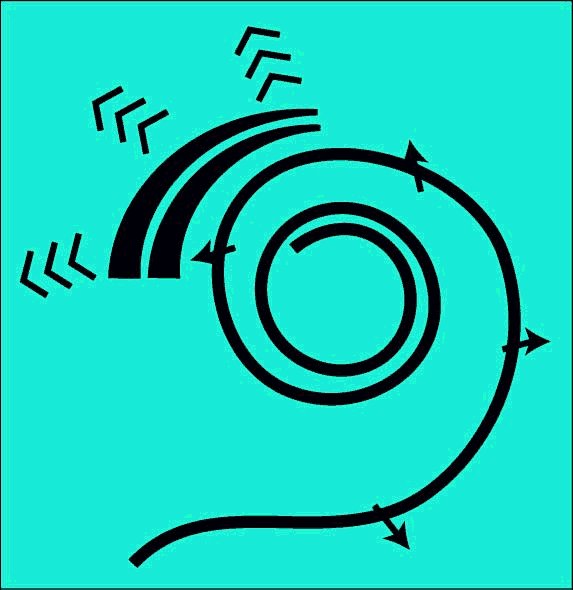
The cochlear duct is formed into a progressive logarithmic helix giving the cochlea its characteristic external shape. Within this spiral, the acoustic energy is dispersed as a function of frequency that depends critically on the local curvature of the spiral as shown below.
The process is known in engineering disciplines as the Marcatili Effect. The individual chevron lines shown crossing the ridge known as Hensen's stripe along the inner edge of the tectorial membrane represent the inner hair cells of the Organ of Corti. The numberics represent the frequency of the acoustic energy being shed by the spiral in humans. The 2.75 turns of the spiral in humans accounts for their wide frequency sensitivity compared to most other animals. The triplet chevrons shown intercepting the shed energy are the outer hair cells.
The Marcatili Effect introduces a selectivity within the hearing modality that is not found in any other biological mechanism. It is introduced in the following figure.
The lower frame shows the cumulative broadband energy traveling along Hensen's stripe until it is shed and transfered to the individual narrowband responses associated with the OHC in the upper frame. This shedding by Hensen's stripe occurs at the dispersal frequency fD. This frequency can be described arbitrarily as the 3 dB down point along the slope. Note the scales on the left They are in dB and not in percent. The values are impressive. The skirts of the responses are down more than 100 dB and the slopes of the responses have been measured at over 65 dB per octave (some measurements have been reported at 1000 dB/octave). Such slopes are unknown in connection with acousto-mechanical (or electronic) resonant circuits. The center frequency of the responses in the upper frames are usually defined by their center frequency. This is typically described as the "best frequency" for the OHC at that point along the tectorial membrane. It is usually determined by locating the residual motion of the side of the basilar membrane (BM) facing the scala tympani. The BM is acting as a )passive) seismic block on which the OHC are mounted.
It has been found productive to introduce two similar frequencies into the ear canal at generally high intensity and listem with a microphone for signals appearing in the ear canal as distortion products. These distortion products are not present in the initial stimulation and are geneally attributed to nonlinear mechanisms within the Organ of Corti (OC). The upper stimulus frequency is conventionally labeled f2 and the lower frequency is labeled f1 with the ratio between them given by f2/f1. The ratio between the two frequencies is typically less than 1.5:1. This ratio is a very important experimental parameter.
When two frequencies are present in a signaling channel and they encounter a dislocation (nonlinearity), the result is the generation of a set of frequencies according to the following formula. fDP = ±m×f2±n×f1 where m and n are integers, excluding zero. The DP's generally consist of a pair of quadratic terms, a set of cubic terms and larger sets of qaartic and quintic terms The quartic and quintic terms are usually of very small amplitude and difficult to detect and measure. The DP's generally are formed at frequencies below f1 and above f2.
Several DP frequencies are generally found in the ear canal at frequencies below f1, particularly
f2 - f1,
2f1 - f2 and
3f1 - 2f2
No frequencies above f2 can generally be detected within the ear canal.The reason is the Marcatili Effect. The situation is illustrated in the following figure using the frequencies explored by He et al. in 2008, f2 = 9.45 kHz and f1 = 9.0 kHz.
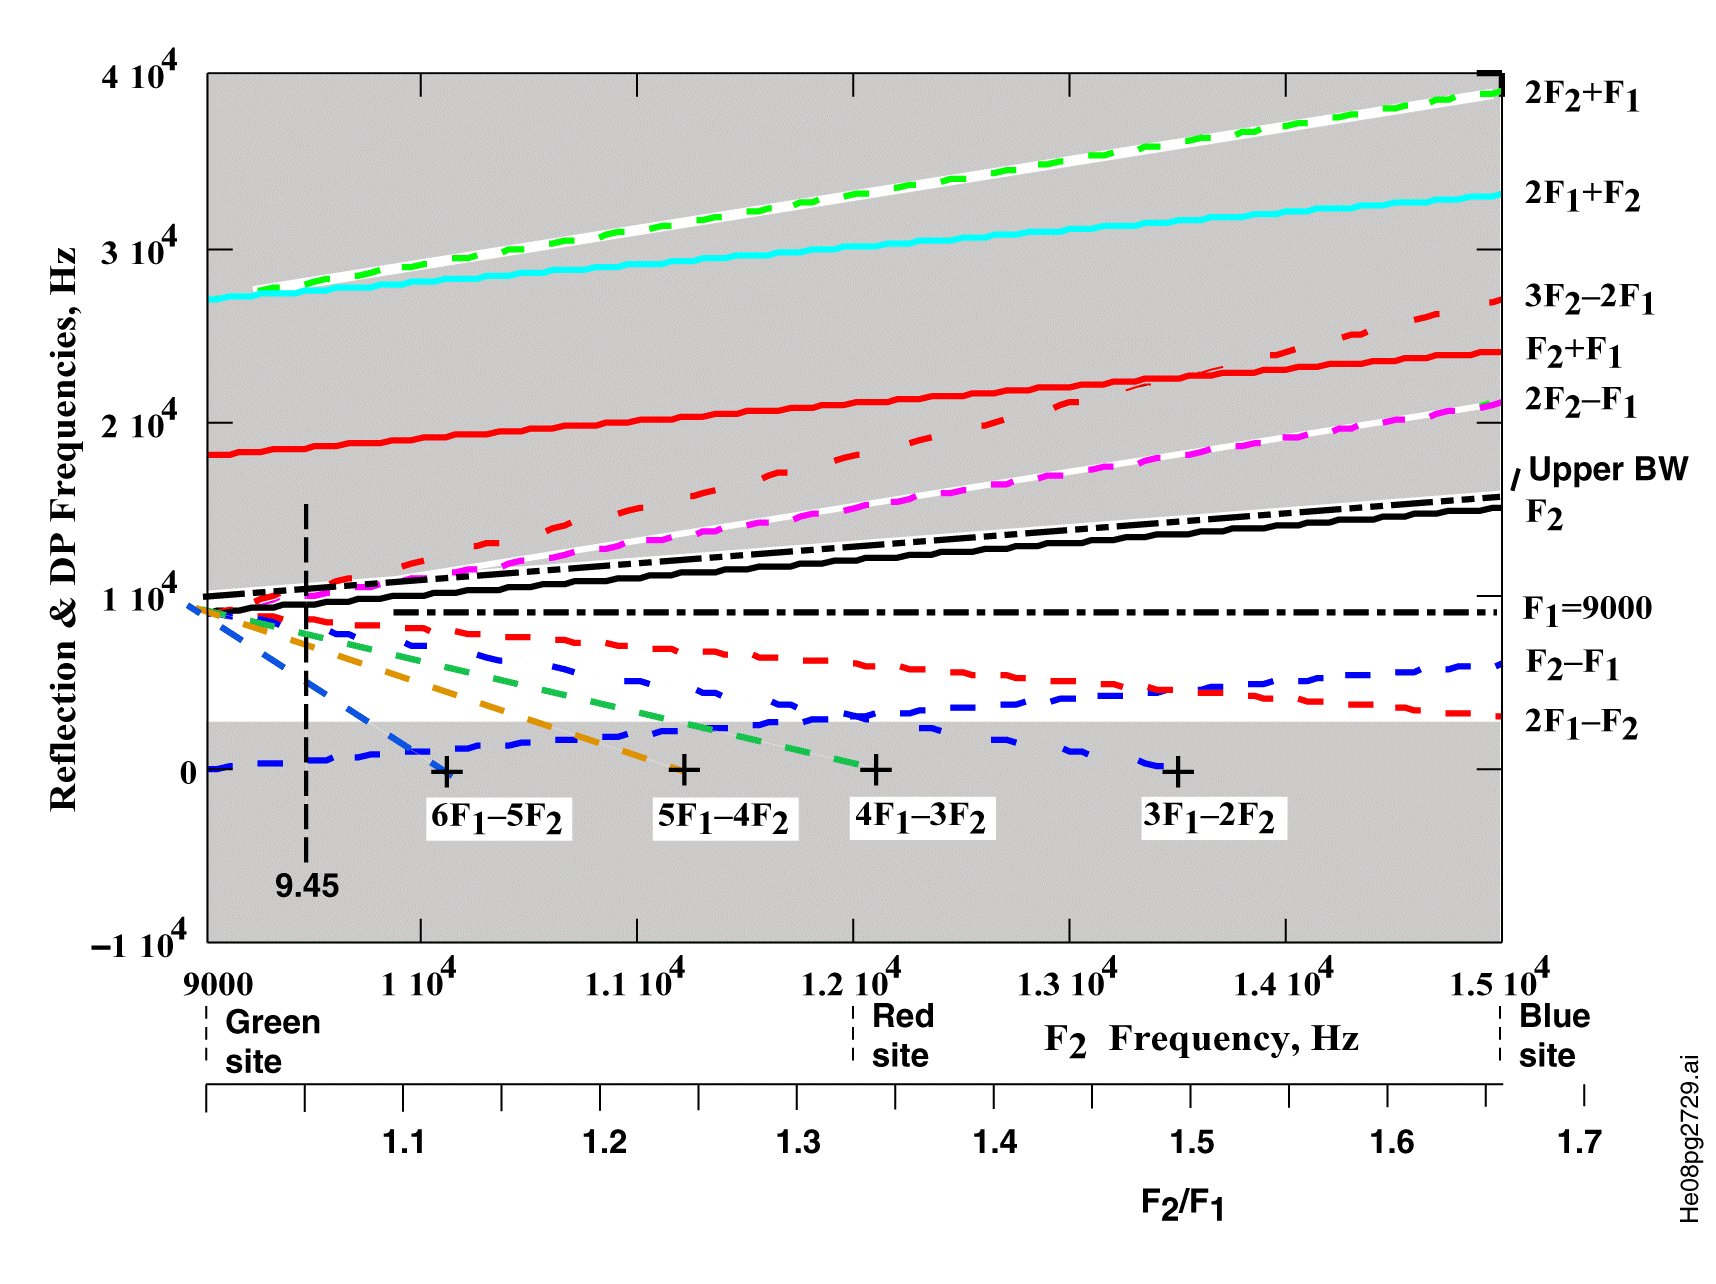
Laboratory measurements (depending on residual basilar membrane motion) generally show the point of discontinuity (nonlinearity) leading to DP generation is at or slightly beyond the point of dispersal for the higher frequency.
The shaded areas cannot support the propagation of DP's generated as surface acoustic waves in the vicinity of a dispersal frequency of 9000 Hz. The lower shaded area is at the functional limit of the Organ of Corti (generally near the helicotrema).
While frequencies below f1 can continue to propagate from their point of generation as forward surface acoustic waves until they reach their dispersal frequency or are reflected at the helicotrema, the frequencies above f2 cannot. At their point of generation, they are at a higher frequency than can propagate in either the forward or backward direction along Hensen's stripe. They are already beyond their dispersal frequency dictated by the Marcatili Effect.
In the case of He et al., the frequencies at 9.9 and 10.35 kHz were not detected in the ear canal. These frequencies were generated at a place beyond the dispersal frequency. Thus, they could not travel as a surface acoustic wave back along Hensen's stripe. The frequncy at 2f1 - f2 = 8.55 kHz did travel backward along Hensen's stripe and was detected and recorded as approximately 40 dB below the frequency of the stimulus waveforms.
As illustrated, the DP at f2 - f1 could be expected to be perceived by the subject for the frequency ratio greater than 1.35:1. The subject could be expected to perceive the DP at 3f1 - 2f2 only for a frequency ratio below 1.35. It is not likely these perceived frequencies could be detected in the ear canal as they would be efficiently absorbed by the OHC after dispersal.
A quick overview of the operation of the cochlea is available as a slide show.
A series of animations describing operation of the Organ of Corti is available.
A brief description of cochlear operation as presented, and published, at the 2008 Mechanics of Hearing Workshop in Keele, England
Return to the Hearing Modality home page.
Return to the website home page.
He, W. Fridberger, A. Porsov, E. Grosh, K. & Ren, T. (2008) Reverse wave propagation in the cochlea PNAS . vol 105(7), pp 27292733