PROCESSES IN BIOLOGICAL VISION has described the complete photosensing mechanisms associated with a specific photoreceptor cell for the first time. This has allowed the mechanisms to be described completely in mathematical form. This page will highlight the mechanisms and mathematics involved. The page is divided into two major parts.
The TRANSDUCTION PROCESSMost of the material supporting this page is available in Chapters 12 and 16 of PROCESSES IN BIOLOGICAL VISION. The material is downloadable from this site. More specific references appear within the page as chapter and paragraph numbers (in brackets). The electron micrographs showing there is no membrane surrounding the outer segment of a chordate photoreceptor are in Section 4.3.5. A reward has been offerred on this site for some years to anyone who can demonstrate the presence of such a membrane.
The photosensing process provides the initial excitation of the neural system. It occurs within the photoreceptor cells of the retina. These cells are quite complex. They transform photons into excited electrons and then free electrons that can be processed within an electrolytic circuit domain. Photosensing is divided into two major parts, transduction of the photons into electrons and translation of the initial electrons into a larger stream of electrons.
The TRANSDUCTION PROCESS is the elegant mechanism that creates electrons from photons and provides a significant degree of flexibility as a function of the photon flux absorbed by the individual outer segment of the photoreceptor cell.
The TRANSLATION PROCESS is the equally elegant mechanism that includes the adaptation amplifier and the distribution amplifier of the photoreceptor cell. It is this mechanism that stabilizes the amplitude of the signals passed to the signal processing neurons of the retina. To aid in this process, the distribution amplifier includes a mechanism for converting the current from the adaptation amplifier to a voltage at the pedicle of the photoreceptor cell.
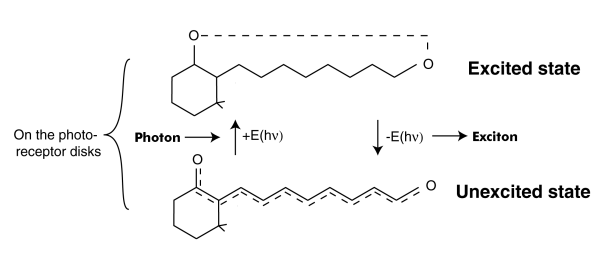
The TRANSDUCTION PROCESS is described here entirely in quantum-mechanical and electrolytic terms. The description is much simpler than that generally found in the literature based on enzymatic activity and gates in a putative membrane surrounding the outer segment of the photoreceptor cells. This putative membrane is a legacy from early work based on light microscopy. More modern electron microscopy does not support the existance of a membrane isolating the disks from the inter-photoreceptor matrix (IPM). See Section 4.3.5. The process revolves around the quantum-mechanical excitation of the retinoids forming the color sensitive material, the chromophore, coating each of the disks of the outer segment -- and the subsequent de-excitation of this materia at the interface with the neural system. The de-excitation causes the generation of an electron-hole pair in the base of a transistor like structure known as an ACTIVA. The following figure illustrates this process. In this figure, the concept of an exciton is employed to describe the energy transmitted through the wall of the dendrite (microtubule) and into the base of the Activa of the photoreceptor cell.
This process is described mathematically by a differential equation of the first order. It has some very special boundary conditions and auxiliary equations. [16.4.1] To solve it completely, it is necessary to use higher mathematics involving the s-plane and complex algebra (of the form x + jy)where j is the imaginary operator. The solution to the differential equation is known as the P/D EQUATION. While it is quite complex, it can be divided into three major parts.
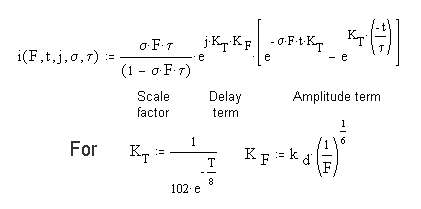
In this equation, F represents the total flux impinging on a single outer segment of a photoreceptor cell. s represents the net absorption at the wavelength of the impinging photons. It may be an average over the spectrum of the chromophore involved. t is the time constant of the de-excitation process at the neural surface. t is time and capital T is temperature in Celsius. Both of the terms s and t are highly dependent on temperature. The factor of 102 causes the two arguments of the exponentials to be expressed in terms of human body temperature. A different constant can be used to express the values in terms of zero Celsius or any other temperature. [16.4.1.2.1]
The SCALE FACTOR in the complete P/D EQUATION is important. It exists in three domains. For sFt = 1.00, the equation exhibits a discontinuity. In this case, the differential equation results in a simpler solution given the name the Hodgkin Solution in this work. [16.4.1.2.1] If sFt > 1.00, the scaling factor is a negative number that approaches 1.00. If sFt < 1.00, the scaling factor becomes proportional to the value of sFt
The DELAY TERM, note the imaginary operator, j, describes the finite time, t0 that passes before any event happens at the output of the circuit. This is the first time this factor has been quantified in the vision literature. As suggested by the auxiliary equations, this factor is a distinct function of both the temperature and the incident flux level.
The AMPLITUDE TERM is the term usually recorded in the laboratory (if the incident photon flux, the stimulus, is not too intense). For high photon fluxes, the recorded response is usually truncated by the subsequent adaptation amplifier.
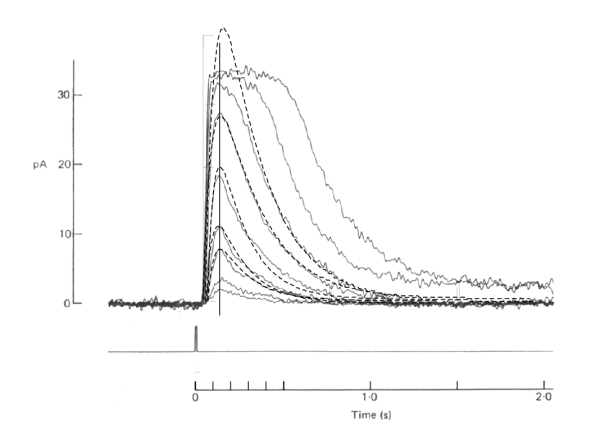
The complete response to a very short flash exposure, known mathmatically as an impulse is illustrated below for a variety of conditions at 37 Celsius. Not the use of two different time scales. The dashed curve corresponds to the Hodgkin Solution.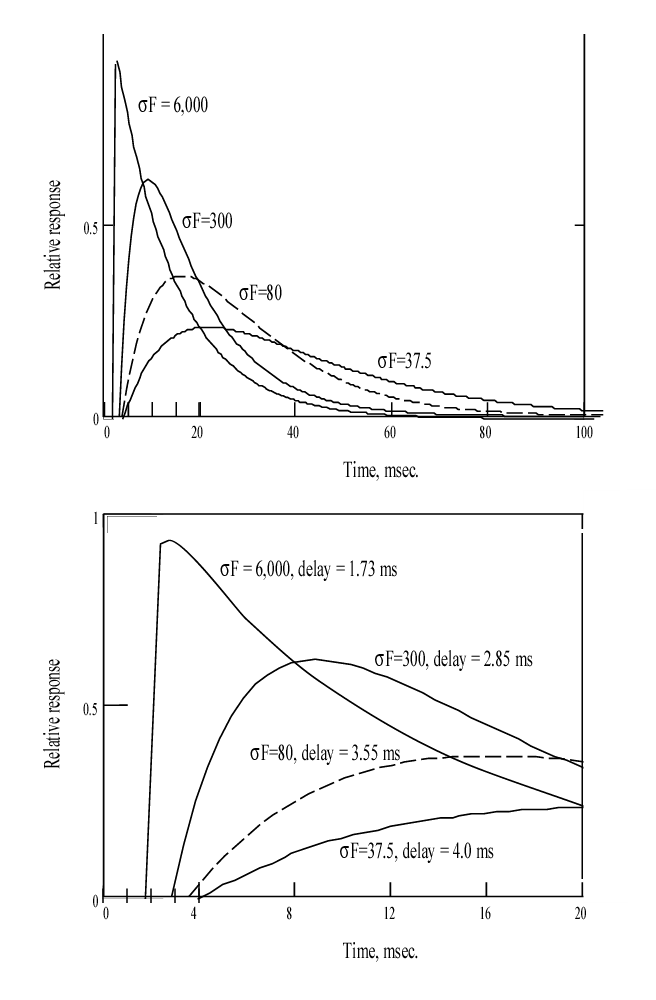
When recording these functions in the laboratory, three situation frequently arise. (1) Test set noise frequently obscures the abrupt departure of the functions from a horizontal line. (2) To improve the noise situation, a narrow band electrical filter is frequently introduced into the instrumentation. This filter has the effect of introducing a small curvature into the response as it leaves the baseline. (3) Finally, the difference in amplitude between these response frequently exceeds the dynamic range of the following amplifier. This causes the higher peaks to frequently be truncated by a horizontal line.
Lacking the complete solution to the P/D EQUATION, it has been difficult for investigators to interpret the continuously changing slope of the complete response. The first derivative of the P/D EQUATION solves this problem.

This equation is very similar to the complete solution except for the additional terms in front of each exponential. The first of these is the most important, it defines the slope of the response at time zero (when the value of the first exponential is 1.00 and the product of the second exponential and the second term is zero). At any other time, the slope is continually changing as described by this equation. For very high values of sFt, the product of the first term and the first exponential rapidly reaches 1.00. As a result, the trailing edge of the total response is represented by the second exponential with the time constant of KT times t ( or just t in the case of humans at 37 Celsius) This condition is illustrated in the above figure for sF=6000.
The complexity of the circuitry in the neural portion of the photoreceptor cell is difficult to describe succinctly. The complete discussion is in Chapter 12. The circuits can be presented symbolically (using the concept of operational amplifiers). Alternately, they can be presented at the detailed level. It is this level that aids in the understanding of the waveforms recorded in the laboratory.
The operational amplifier approach is useful in defining the conceptual mode of operation. [16.2.1]
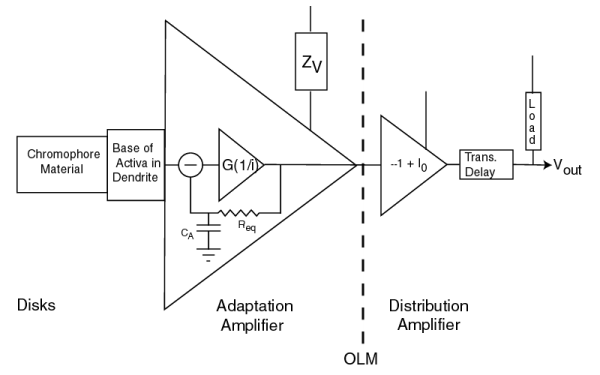
This diagram shows the circuitry of the photoreceptor cell is a member of a class defined by Tranchina. The chromophores, combined with the base of the activa within the neuron acts as an initial filter (that is generally linear, but not always). It is followed by an operational amplifier containing an internal negative feedback loop. This operational amplifier performs two functions. First, it removes the average value (or DC component) from the signal received from the chromophores. Second, it amplifies the remaining signal in inverse proportion to the applied electron current, i. The result is an output of standardized amplitude regardless of the input signal amplitued (within the operating range of the amplifier). This standardized signal does not contain a DC component related to the excitation. The power supply for this circuit (ZV) is provided by the vascular system using a mechanism known as electrostenolytics. It is the limitations of this supply that account for the well known dark (and light) adaptation characteristics of vision.
The second operational amplifier is used to establish a lower impedance electrolytic signal that can be distributed to subsequent neurons. It does this by inverting the signal (using a gain of minus one) and introducing a bias, I0. Finally, the current is logarithmically converted to a voltage at the pedicle. The current passing through the axon to the pedicle encounters a significant delay. Electrons passing through liquids move 100,000 times slower than when passing through metallic wires.
The two circuits shown as operational amplifiers above actually exist as a common circuit known as a differential pair.
The portion of the circuit within the jagged box to the left of the impedance marked (2)represents the first operational amplifier in the previous figure (the adapatation amplifier). The portion of the circuit to the right of that impedance represents the second amplifier (the distribution amplifier).[11.1.5] The symbols commonly used to designate solid state semiconductors (transistors) are used here to designate liquid crystalline state semiconductors (ACTIVA).
(1) in this figure represents the impedance ZV of the previous figure. (4) represents the diode impedance causing the logarithmic conversion of the amplifier current to the pedicle voltage. (2) is the common impedance between the two amplifiers. It defines the character of the circuit as a differential pair. It is also responsible for the negative internal feedback within the left hand circuit. (3) is the bias that creates the offset current, I0.
The large arrows at the top of the figure represent the currents and voltages normally measured using ERG and LERG techniques. These are discussed more fully in Section 16.7.2.
The complete P/D EQUATION describes the measured data in the literature exceedingly well. The following figure shows the theoretical curves (dashed) overlaid on the measurements of Baylor & Nunn. Only the curves that were not saturated were overlaid. However, it is clear that other curves of higher sF would also match the non truncated parts of the curves. The lower curves are also matched but a separate figure is needed to demonstrate the match clearly.
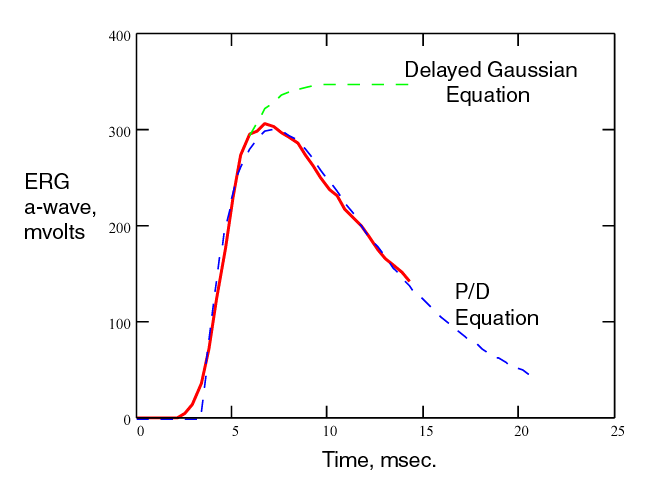
The complete P/D EQUATION also describes the first portion of the conventional ERG completely. The red line is a typical ERG response from Smith & Lamb. The dashed blue line is the complete P/D EQUATION overlaying the measured data. The dashed green line represents the alternate approach in the literature. That approach only attempts to describe the leading edge of the ERG. However, it is widely used as if it were the mathematically precise description of the P/D process. The assumption being that other neural signals corrupt the measured waveform beginning near the peak of the recorded function. The corruption actually occurs after the first 15 milliseconds due the the finite delay between the output of the photoreceptor cells and the output of subsequent signal processing neurons. [The complete ERG is modeled in Section 16.7.2]
