
This page is in beta release. The author welcomes and will respond to any comments or suggestions left at the comment page. Section numbers of the main manuscript, available on the web, are shown in brackets. The manuscript can provide more detail when desired. The first number shown is the chapter number; it is followed by the section numbers. Download individual chapters.
In 1958, Dr Edwin H. Land, founder and principle stockholder in the Polaroid Corporation, gave a series of demonstrations of unusual visual effects that he asserted could not be explained with the Theory of Color Vision accepted at that time. While a highly respected business man and scientist, he was also a superb showman on stage. However, he was an experimentalist of the Thomas A. Edison school. At the time he offered no theoretical explanation of his findings but merely undermined the generally excepted theory.
In his prepared remarks and the first paragraph of his first published paper1, Land asserted that "We have come to the conclusion that the classical laws of color mixing conceal great basic laws of color vision. There is a discrepancy between the conclusions that one would reach on the basis of the standard theory of color mixing and the results we obtain in studying total images." His reference is to the conventional wisdom that vision was/is based on additive color mixing. "This departure from what we expect on the basis of colorimetry is not a small effect but is complete, and we conclude that the factors in color vision hitherto regarded as determinative are significant only in a certain special case. What has misled us all is the accidental universality of this special case."
In his second paper2, Land summarized the observed phenomena in a single figure that has been modified here by the addition of more finely divided wavelength scales. He concluded that the perception of color "depends on a ratio of ratios; namely, as numerator, the amount of a long-wave stimulus at a point as compared with the amount that might be there; and, as a denominator, the amount of a shorter wave stimulus at that point as compared with the amount that might be there." Although, Land was approaching the actual case, he remained far from a precise definition of the situation (and the terms he used lacked precision in the context of today).
Because of the lack of rigorous scientific controls in the course of his public audience-based demonstrations and his obvious skills as a showman, his results were not received well by the scientific community to which he was a prominent member. "Although generally regarded as fascinating research by the physicists, and the research community, these observations irritated, if not inflamed, the color vision community4." Many considered the experiments as containing subtle events that introduced changes in adaptation and other phenomena not unlike those achieved in the typical magic act in order to control the perception of the audience.
The third paper in the series, promised in the closing of the second, never appeared. However, a paper defining an initial version of the Retinex Theory of Color Vision, coauthored with his long-time colleague, did appear in 1971, twelve years later3. The theory was largely conceptual but did assert it applied to a system of three spectrally narrowband photoreceptors. The concept of a broadband rod was not included in the paper. The discussion was based on a three projector configuration using three fixed filters with spectral widths of 50-100 nm. It did not refer to or offer a rigorous explanation of the experiments in the second paper.
Land & McCann defined the term retinex to describe each of the spectral subsystems of the complete retinal system applicable to vision. They describe a system of three spectrally separate subsystems extending from the retina to the cortex. They assert the spectral images are not mixed but are compared. Beyond that assertion, they did not discuss the architecture or the specific circuitry of the neurological system. Looking back, the context of their work makes it clear they were thinking in terms of the linear operation of the visual system as appropriate to the lower photopic and mesotopic regime in all three papers.
The Retinex Theory as originally conceived is incompatible with the current zone models of vision where significant spectral signal differencing occurs in the retina. The zone model defined in this work is presented in the Visual Block Diagram for humans The validity of the proposed zone model includes its ability to describe the results of the Land experiments in detail.
A more detailed description of the zone model of this theory is shown in the Overall Block Diagram.
The title Retinex Theory has been transformed in the subsequent technical literature so that the title is also used to describe methods, largely computer algorithms, to improve the contrast performance of imagery containing large dynamic ranges (basically improving the visibility of detail obscured in shadowed areas of scenes). Attempts have also been made to show the Retinex Theory underlies the phenomenon of color constancy. However, the conceptual level of the theory has not led to a definitive explanation of color constancy5.
The Electrolytic Theory of the Visual Process (a title used on this page to avoid confusion due to the alternate title, Tetrachromatic Theory of Biological Vision) presented in this work provides a rigorous explanation of Dr. Land's experiments and provides additional insights into those experiments that can be experimentally verified. This will be demonstrated below. This paper does not concern itself with color constancy or contrast enhancement of scene details. A different concept and architecture of color constancy is offered in Chapter 7.
Subsequent to the arrival of the INTERNET, something of a cottage industry has arisen attempting to develop algorithms to perform contrast enhancement based on Land's findings. While consisting of interesting mathematical manipulations in computer controlled spaces, most have not proven robust. Their applicability to biological vision has been distinctly limited.
Dr. Land worked in a time period where photographic film was the medium of choice in the preparation of visual experiments. Preparing technical slides for projection purposes was an involved process. The time period was prior to the development of the laser as a light source and film was relatively insensitive to light (compared to current imaging devices). His basic apparatus is shown in the following figure.
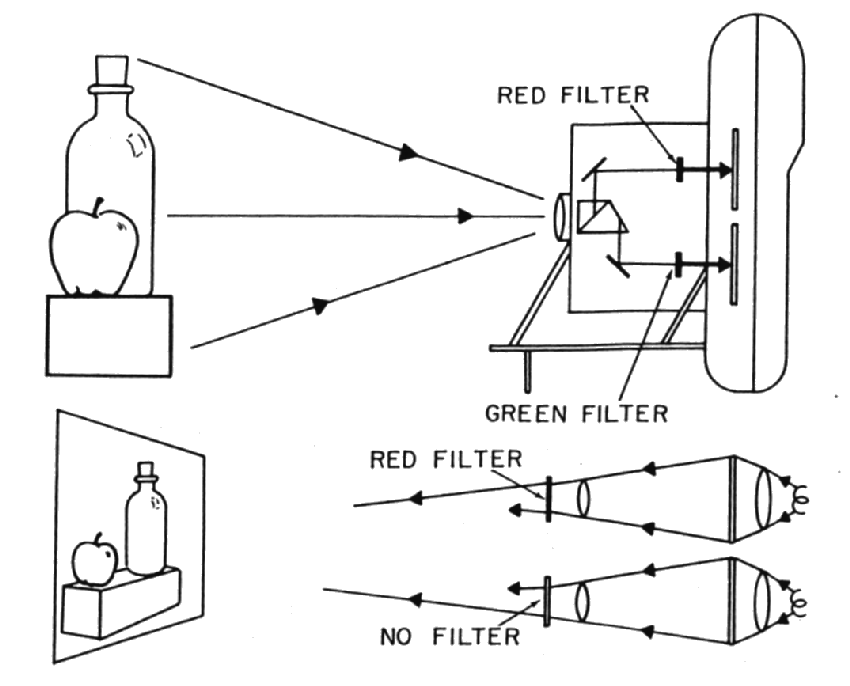
Because of the limited sensitivity of his acquisition instrumentation, built around an early Instant Photography camera and type 46L transparency film, he used relatively broad spectrum gelatin filters in his optical paths. These Wratten filters were and still are a product of Eastman Kodak Company. The filters he chose and described in detail were carefully selected as a result of his empirical approach to science. Many of his results are critically dependent on the filters used.
Land's protocol was to acquire a pair of images that could be turned into slides using two filters in the optical path of the camera. The two slides would be used to project two images in superimposition at the screen location using different filters in the optical paths.
In the initial demonstration,
Subsequent demonstrations varied the filters used in each projected light path systematically using a group of about ten filters.
A more compact version of this equipment was developed using dual path monochrometers. This provided a more convenient laboratory test configuration.
Dr. Land developed and demonstrated his findings indoors and as a result, the lighting conditions were estimated by this author to be in the lower photopic or mesotopic regimes, regimes where the human visual system is operating at near full adaptation amplifier gain but the output of the sensory neurons remains in a quasi-linear region. This is not the regime controlled by the color constancy phenomenon. The color temperature of his light sources was not a matter of major interest at the time.
Land described a majority of his audiences and experimental subjects as untrained in the purpose of the experiments (except for those few in the audience who were trained vision scientists attracted to the presentation). Little effort was made to evaluate the visual performance of individual participants.
Land suggested that the number of participants was not sufficient to achieve high statistical accuracy in determining the borders between the regions of unusual observed performance.
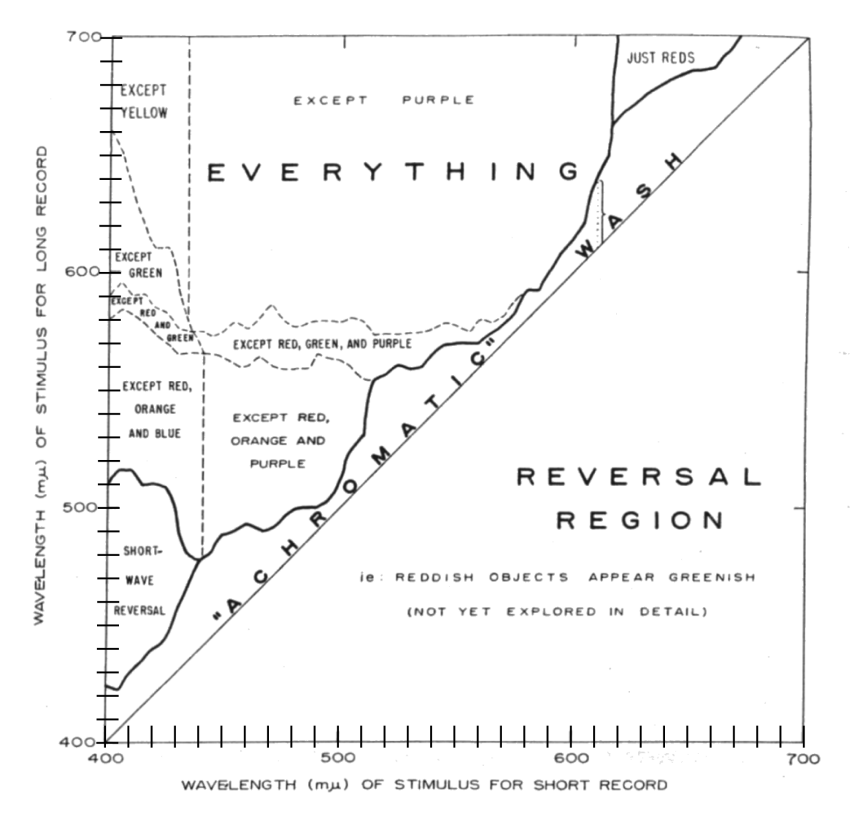
Land produced a summary figure in his second paper that described the results of his experiments.
In this figure, narrow bands of radiation (based on gelatin filters) centered on a specific wavelength are projected onto a screen or image plane in registration by one of the two paths. The area above the 45 degree diagonal includes by definition, all combinations of wavelengths where the (center wavelength of the) stimulus for the long record is longer than the (center wavelength of the) stimulus for the short record. In the area below the diagonal, the situation is reversed. Land makes other global assertions that are too broad to defend in their entirety. Along the diagonal, Land has defined an "achromatic wash." By this he means an area where the scene exhibits a characteristic color defined by the wavelength of the two lights but it does not exhibit a broader color gamut. A color gamut is only obtained when the difference between the two wavelengths exceeds a minimum value.
Two examples of how the figure is used can be given based on page 639 of Land. First, examine the area labeled the "achromatic wash." Pick a wavelength for the short record on the horizontal axis, say 610 nm. Project up to the heavy line above the diagonal and then horizontally to the ordinate. The value of the ordinate is 640 nm. The area of the "wash" is 30 nm wide as shown by the dotted vertical line. For wavelengths of less than 30 nm at 610 nm, no color spectrum will be observed. A difference of more than 30 nm must be used if the images are to display a full color spectrum in accordance with the notation "everything." At less than a 30 nm difference, only a reddish image will be obtained. Second, consider 475 nm as the short record stimulus. The long record must have a wavelength centered on 495 nm or higher in order to perceive an image containing yellow, green, blue, brown, black, white, and gray will appear. "If the long wavelength is centered on 560 nm, the green will disappear and orange will be added; and at 570 nm, the gamut is complete: "everything" (except purple) is in the image." Land also notes that only reds are perceived in the upper right corner and a spectral reversal occurs in the lower left corner. To achieve the maximum range of color gamuts in a given region of the figure, it was necessary to vary the intensity of one or both of the projector sources.
Land gives several more examples in his text before stating his hypothesis. However, he gives no theory as to why these situations occur. His hypothesis is: Color in images cannot be described in terms of wave-length and, in so far as the color is changed by alteration of wave-length, the change does not follow the rules of color-mixing theory." This hypothesis is unusual in that it is written entirely in the negative. Although not stated explicitly in the papers, Land acknowledged frequently that the colors perceived in his images were generally very unsaturated.
The complicated structure of the figure provided above suggests an underlying structure to the perceptual system causing it. The figure is reproduced below with an overlay drawn from the Electrolytic Theory of Vision. This Theory will be discussed in greater detail below. The overlay consists of the three peak spectral wavelengths of the visual photoreceptors at 437, 532 and 625 nm. Also shown are the null lines (P = 0) at 572 nm associated with yellow and at 494 nm (Q = 0) associated with azure. The null lines are only drawn horizontally where they relate to the upper left portion of the image.
The overlay lines follow closely several of the borders determined by Land. Note the dashed vertical lines paralleling the vertical 437 nm line. Note the region bounded by the dashed lines and including the horizontal 572 nm line. Note the vertical line paralleling the vertical 625 nm at upper right. Other measured lines also parallel the measured borders less closely.
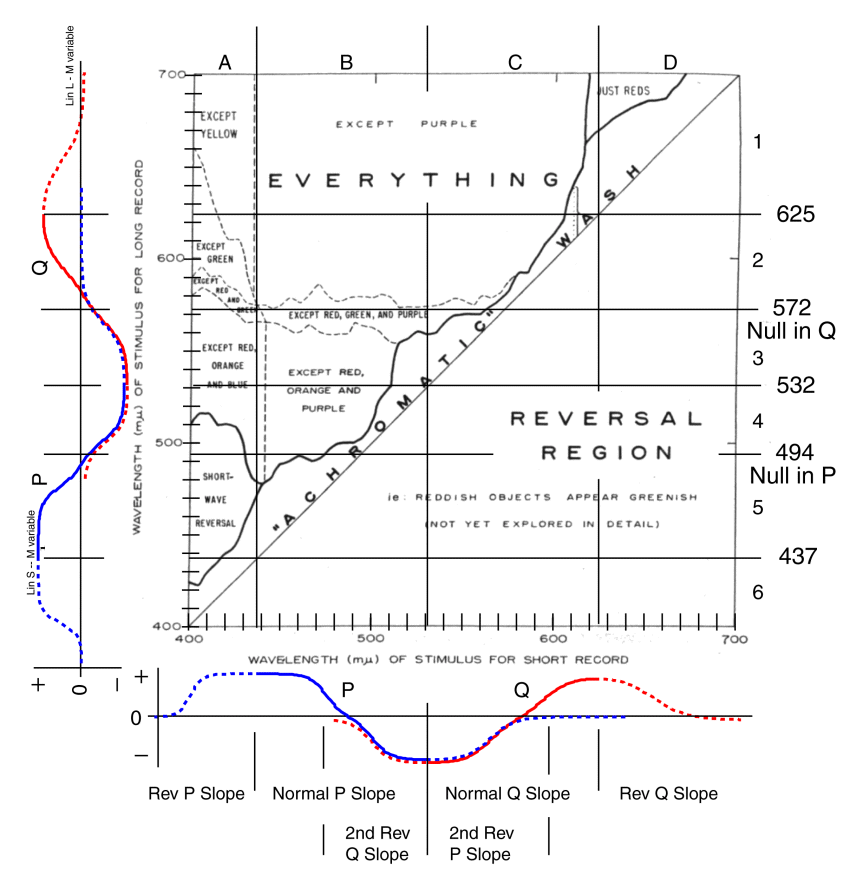
The Electrolytic Theory of Vision is a comprehensive theory addressing all aspects of vision and the neurological circuits that support vision. It describes the signals traversing the optic nerve in terms of three principle groups. The R-channel, of many individual neurons, describing the brightness information obtained from small areas of the scene through summation processing in the retina. It describes two chrominance channels, the P-channel representing neurons describing the difference between the S-channel (blue) component and the M-channel (green)component of small areas of the scene. It also describes the Q-channel representing neurons describing the difference between the L-channel (red) component and the M-channel (green)component of small areas of the scene. The bipolar response generated by these difference signals are shown in the auxiliary scales along the two sides of the figure. The representations are identical in this format except for the rotation of one by 90 degrees.
The character of the P- and Q-channel signals is developed in detail in [Section 17.3]. These theoretical functions are equivalent to the empirically measured functions of Hurvich & Jameson6. The theoretical functions show that the nominal zero amplitude values of Hurvich & Jameson were displaced from ideal.
During the normal operation of vision, the P-channel signal operates between wavelengths of 437 nm and 532 nm as shown by the solid line marked P. This signal is a bipolar signal with an amplitude and polarity as indicated by the ordinate on the left of each scale. A similar Q-channel signal operates normally between wavelengths of 532 nm and 625 nm as shown by the solid line marked Q along each scale. These two signals exhibit characteristic slopes with respect to wavelength within their active region. These are labeled the normal slopes at the bottom of the figure. The P-signals are positive in the region of the blues and purples and negative in the region of the greens. The Q-signals are positive in the region of the reds and oranges and negative in the region of the greens. Since these signals are differences between absorption spectra, they return to zero in regions outside of the normal operation of these absorbers. This is illustrated by the regions shown dotted and labeled reverse slope regions.
A null value in the Q-channel is represented by the violet-yellow axis of Hering color space. A null value in the P-channel is represented by the azure-red axis of Hering color space. See [Section 17.3] for the definition of the Hering Color Space in greater detail.
When the visual system senses a zero (or null) in the Q-channel, it reports a lack of color to the higher cortical centers of the brain. In the presence of a negative P-channel signal, the brain perceives this condition as representing yellow in the scene. This occurs in the region of 572 nm. When the visual system senses a zero (or null) in the P-channel, it reports a lack of color to the higher cortical centers of the brain. In the presence of a negative Q-channel signal, the brain perceives this condition as representing azure in the scene. This occurs in the region of 494 nm. When null values are reported in both the P- and Q-channels, the condition is perceived as a colorless or white area of the scene.
The three paragraphs above define the visual system as operating based on color differences and not color summations. This color differencing is the key to the operation of the visual system. It contrasts with the conventional assumption, rejected by Land, that the visual system was based on the summation spectral energy at specific wavelengths.
Based on the auxiliary scales, it is quickly seen that the area of the figure labeled "EVERYTHING" conforms to the normal region of P & Q signal operation for the "short record." The same situation would be found for the long record in the area marked "REVERSAL REGION." The oddities observed by Land are concentrated in the regions of the P & Q signals involving the reverse slopes. These regions are particularly interesting in that they exhibit the opposite variation in perceived color with respect to wavelength as found in the normal slope regions (the color gamuts are reversed).
To interpret the measured data more fully requires evaluation of the potentials created in the P and Q channels defined by the Electrolytic Theory of the Visual Process. These are the same P & Q channel values within the mechanism used to create the first order Perceived Chromaticity Diagram of this work (xxx provide hyperlink). In this case, Dr. Land's findings are in agreement with a second order version of the same mechanism. Unfortunately, Land did not define individual colors precisely and some of his notations are incomplete. Certain inferences can be made by studying the measured data carefully. Based on the labels in the center-left of the figure, purple appears to be defined as a wavelength between 420-437 nm. Blue on the other hand appears to be defined as a wavelength between 437-450 nm. Interestingly, Land did not speak of magenta, an important color in color photography.
The following discussion does not include the effect of other tertiary mechanisms like absorption by the macular lutea. The Perceptual Chromaticity Diagram developed in [Section 17.3] can be used to track the following discussion.
To achieve a perception of yellow in sector A1 requires the value of P must be negative and Q must be zero. As shown at the bottom left, only positive P values occur in the region of 400 to 437 nm. Therefore, the color gamut in sector A1 cannot include yellow (as asserted by Land). Reading the P and Q values from the auxiliary scales, it can be specified that the upper left corner of sector A1 appears nearly white. The lower right of sector A1 will appear magenta with high values of P and Q.
Interpreting the auxiliary P & Q scales, sector A2 is perceived as a range of magentas in the upper right corner (high P & Q values) blending to white at the lower left ( P & Q near zero). No part of this sector can be perceived as green because Q > 0 in this sector. The lower edge of this sector appears white on the left and approaches blue on the right.
Interpreting the auxiliary P & Q scales, sector A3 is perceived as various shades of green. No perception of reds, oranges or blues can be perceived in this area. The lower edge of this sector appears green.
Interpreting the auxiliary P & Q scales, sector A4 is perceived as white on the left of the lower edge blending to blue or purple on the right of the lower edge. It will blend to green along the top edge. No perception of reds, yellows or oranges can be perceived in this area as noted by Land.
Interpreting the auxiliary P & Q scales, sector A5 is perceived as a range of desaturated blues because the Q value is zero. The lower edge will appear quite blue. It is difficult to evaluate precisely the short-wave reversal described in brief by Land. The reversal appears to be more complex than Land described because the short record is operating in the reverse P slope region while the long record is operating in the normal slope region.
Interpreting the auxiliary P & Q scales, sector D1 is perceived as a range of desaturated reds because the P value is zero. No greens, blues, or yellows will be perceived because of the positive value of Q. More data is required to interpret sector D1 in detail. Both the short record and the long record are operating in the reversed Q slope area. For the region of wavelength greater than 680 nm in the long record, only the redness of the short record in the region of 625 nm to 660 nm will be perceived. In the shorter wavelength region of the long record (625 nm to less than 680 nm), it is likely a long-wave reversal will be observed similar to that in sector A5.
Sector B1 is normally outside of the conventional visual spectrum (beyond 625 nm). It is characterized by a reversal of the gamut due to the reversed Q slope in this region. The comment "except purple" in the figure is a generic one. A region of purple should be perceived in the upper left of this sector due to the high P value. The color probably blends to a magenta at the lower left.
Sector B2 exhibits a conventional color gamut because the P- and Q-channels are operating in the normal slope regions. The lower edge of this sector will appear yellow at each extreme (that is not red, green or blue [purple]) because of the null in the Q-channel. It will appear white (that is not red, green or blue [purple]) in the middle because of the null in both the P- and Q-channels.
The labeling of sectors B3 and B4 by Land can be refined. In sector B3, the perceived colors will be primarily greens and blue greens. In sector B4, the perceived colors will be primarily blue at the lower left, moving toward green at the upper left. The lower right will blend toward white. The upper right will blend toward green.
Sector C2 will exhibit a normal color gamut when the two source colors are varied because this sector is represented by the normal slope regions for both the P- and Q-channels.
Sector C1 (like sector B1) will exhibit an unusual color gamut. Near the upper edge, the sector will exhibit a normal color gamut as determined by the light from the short record. However, as the wavelength of the long record is reduced, the reverse slope of the Q-channel will become significant in the composite. At the lower right, the perceived color will be reddish. At the lower left, the color will be critically dependent on the intensity of the two stimuli.
The major finding of this analysis is that Land was absolutely correct. The physiological mechanisms of color vision do not employ the rules of color mixing theory based on summation. Grassman's Laws of color additivity are not used within the neurological system of vision. In accordance with the Electrolytic Theory, a two channel neural chrominance system is used where each channel involves color differencing (not summation). The two channels are evaluated individually by the higher cortex [Section 17.3].
The Electrolytic Theory of Vision developed in this work provides a totally deterministic and detailed explanation of the data collected during Land's experiments. Alternately, The Electrolytic Theory of Vision proposed in this work is supported by the experiments of Land during the 1950's. The theory can predict the color observed by Land in each of the sectors of his graph.
Land's original hypothesis can be stated in the positive based on his measurements and the Electrolytic Theory of Vision. The first part of his hypothesis (page 637) can be restated as follows. "Color in images can be described in terms of wave-length and, in so far as the color is changed by alteration of wave-length, the change does follow the rules of color mixing described in the Electrolytic Theory of vision. The change does not follow the rules of color-mixing theory based on Grassman's Laws." The second part of his hypothesis (page 640) can also be restated. "The perceived colors in an image are dependent on the relative energies of the two stimuli according to a more complex relationship than implied by the color-mixing theory based on Grassman's Laws.
While it could be implied from the logic of Land, it is not appropriate to speak of the ratio between the P & Q channels. They are treated as if they were orthogonal. When Land speaks of ratios of ratios, he is referring to the relative intensity of the lights illuminating a small area of the scene and the relative wavelengths of those lights relative to the points giving maximum P or Q values.
Grassman's Laws remain valid for the preparation of colors using multiple lights in object space. However, they do not apply to the storage in saliency space of the brain and perception of those lights.
1Land, E. (1959) Color Vision and the Natural Image. Part I PNAS vol 45, pp 115-129
2Land, E. (1959) Color Vision and the Natural Image. Part II PNAS vol 45, pp 636-644
3Land, E. & McCann, J. (1971) Lighness and Retinex Theory JOSA vol 61(1), pp 1-11
4McCann, J. Benton, J. & McKee, S. (2004) Red-white projections and rod/long-wave cone color: an annotated bibliography J Electr Imaging vol 31(1), pp 8-14
5Brainard, D. & Wandell, B. (1986) Analysis of the retinex theory of color vision J Opt Soc Am A vol 3(10), pp 1651-1661
6Hurvich, L. & Jameson, D. (1955) Some quantitative aspects of an opponent-colors theory. II. J Opt Soc Am vol 45, pp 602+