This page is in beta release. The reason is simple, it is now known that the human visual system does make use of the Ultraviolet (UV) photoreceptors in the retina in a third chromatic channel described by a third chrominance channel,
O = logUV - LogS. The high absorption of the lens in the UV region precludes this spectral channel playing a significant role in the luminance channel performance of vision. This revelation introduces a discontinuity in the New Perception-based Chromaticity Diagram along the 437 nm locus. While the New Chromaticity Diagram is rectilinear, projections on the diagram are not possible across the 437 nm discontinuity. The author welcomes and will respond to any comments or suggestions left at the comment page.
These pages are designed to support the COLORFEST activities associated with the contrast performance of the human eye. That activity is a follow-on the the earlier, and on-going MODELFEST activity. That MODELFEST is a joint effort between the academic and industrial community to quantify the contrast performance of the human eye through standardized psychophysical testing. The effort began in 1996 with the results of the Phase 1 effort appearing in 1999. The current protocol and some test results are available at the above site.
The preliminary goal of this COLORFEST has been described by Sophie Wuerger:
1. How to assess the contrast sensitivity functions (CSFs) for chromatic
modulations
(e.g. along which colour directions are we going to measure the CSFs?
2. How to assess the summation across the different channels at detection level (e.g. which intermediate color directions are most informative to estimate the summation/facilitation/masking across different channels?)
While the achromatic MODELFEST activity has focussed on largely abstract empirical models of the contrast performance of the human visual system (HVS) so far (simple mathematical equations but sophisticated statistical analysis), the chromatic contrast performance is considerably more complex and requires more attention to the detailed operation of the visual system.
These pages will focus on the more fundamental electrophysiological mechanisms of the HVS in order to more effectively guide the psychophysical experimentalist.
The equivalent MODELFEST pages surfaced a number of problems with the empirical approach. The most important of these is the fact the achromatic contrast sensitivity function(s) of the HVS are functions of the illumination level used to collect the experimental data.
The most important facts related to the chromatic contrast sensitivity function(s) of the HVS are:
As a result,
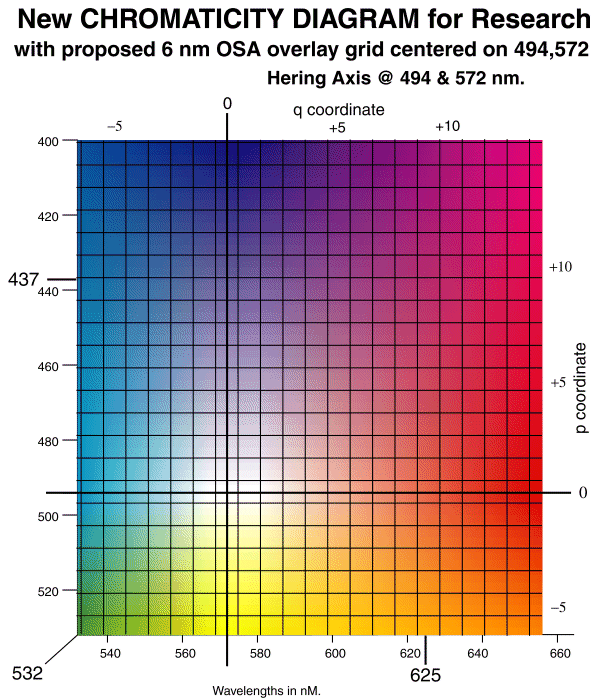
The following material will rely upon the comprehensive model and theory provided in the treatise, PROCESSES IN BIOLOGICAL VISION. Paragraph numbers that appear within square brackets refer to Sections within that treatise. The first numeric gives the chapter number within the work. Individual chapters may be downloaded from the above site to locate complete references. Of particular interest is a NEW CHROMATICITY DIAGRAM FOR RESEARCH that describes the operation of the visual system and forms the foundation of an OSA Color Space compatible with the MacLeod-Boynton-Derrington-Krauskopf-Lennie (MB-KLB)Color Space. Relevant Portions of that treatise were presented at the 2001 OSA Annual Convention in Long Beach (and at the splinter group meeting held at UCI).

The scales at top and right are in p,q space coordinates that are directly related to the wavelength of light AND the S and (L&M) coordinates of psychophysics.
The horizontal and vertical axes correspond to a proposed OSA (p,q) color space that differs from the previously defined OSA (j,g) color space. The OSA (j,g) color space is rotated 45 degrees relative to the (p,q) space used here. The theoretical relationships between all of these Color Spaces is available [17.3 & 17.4]. A comprehensive compilation of the parameters of the STANDARDIZED HUMAN EYE is also available.
The fundamental premise of this work is that the HVS along with the visual system of other large chordates employs a more complex signal processing architecture than usually assumed.

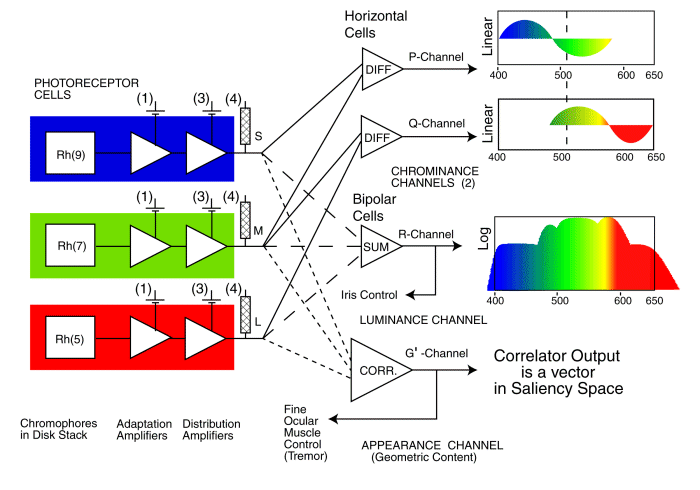
The signal processing architecture of the retina of the human and other large long wavelength trichromats. The theoretical waveforms shown on the right are the same as those recorded by Tomita, Svaetichin and Hsia & Graham (all in the 1950's).
The most important features of the architecture of the retina of the HVS include:
[*** Please note the opening statement concerning the role of the UV channel in human vision.***
The results of this architecture are significant.
Following the retina, the visual system employs a signal projection stage (Stage 3) to pass signals over the optic nerve and on to other areas of the brain. This projection stage employs asymmetrical encoding techniques that impact the color contrast sensitivity functions of the HVS. The primary impact is a function of time. Because motion is translated into temporal frequency, both stimuli motion and duration becomes a critical factor in psychophysical testing to determine chromatic contrast thresholds.
As a result of the asymmetry in the encoding of the P- and Q-channels,
The above asymmetries were studied in detail in the early 1950's for a particular application, the development work of the National(Color)Television System Committee. [Full report available in libraries under Library of Congress #TK6670.N3].
The same asymmetries were noted, but not discussed, on page 651 0f Mullen, et. al. [Vision Res. (2000) 40 pp 639-655]
In essence, S to L and L to S transitions are perceived approximately three times slower than magenta to M transitions. M to magenta transitions are also slow. These findings were so significant, they played a major part in defining the chromatic axes used to transmit color television throughout the world.Hutson, G. has provided a concise summary of the NTSC findings in his Appendix A, although the language is engineering. [LoC #TK6670.H8] The NTSC defined their I (In phase) & Q (Quadrature) axes to be used in color television

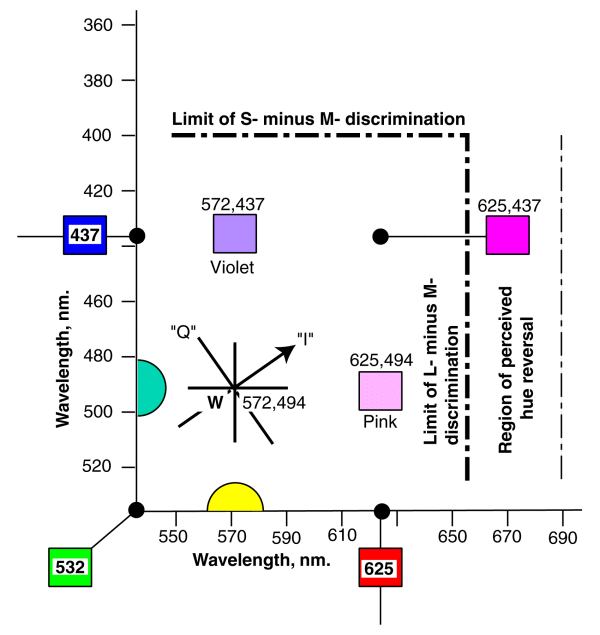
The I & Q axes of the NTSC Color Space and the "major colors" of the NEW CHROMATICITY DIAGRAM. The I channel is only given 1/3 of the electrical bandwidth of the Q channel in order to match the requirements of the HVS.
The following material will be presented in the following order:
There has been inadequate attention to the naming of colors in the past. This has been due to a lack of linkage between semantic names and the associated wavelengths of light. It is crucial that more adequate definitions be provided before discussing color contrast scientifically. The NEW CHROMATICITY DIAGRAM for RESEARCH provides a method to do this and answers the question concerning "cardinal axes."
In the above figure, the location of the conventional three primary colors are shown as spectral (or rainbow) colors. In addition, "white" does not occur in the center of the color space. The visual system divides the electromagnetic spectrum into two sections and then processes the signals from these two sections as if they were orthogonal. This is the origin of the spectral locus in the figure. As will be shown below, the equations used in this processing exhibit nulls at P(494 nm) and Q(572 nm). Lines perpendicular to these values along the spectral locus intersect at the "white point"
Note that the three primary colors do not exhibit any unique position relative to "white."
In the "special subtractive color space of vision," magenta occupies a special place complementary to that of green.
Further, neither the red-green or green-blue portions of the spectral locus pass through "white."
There are no unique names for many of the principle colors in the HVS color space and yellow is used as a narrowband color name in additive color and as a broadband color name in subtractive (process) color. Therefore, certain license has been taken to redefine broadband yellow as goldenrod (for scientific purposes) and to define the color at 494 nm as aqua. Its complement is named pink and the complement of yellow (actually a yellow-green in appearance) at 572 nm is named violet.
With the above definitions, the cardinal axes (corresponding to the Hering Axes) are given by violet-"white"-yellow and aqua-"white"-pink. These are also the axes of the MB-DKL space of psychophysics.
The colors highlighted above can be labeled as "unique colors" and defined specifically in terms of spectral wavelengths.
To prepare a precise evaluation of the chromatic contrast sensitivity functions, the proceedures recommended on a separate page for the achromatic case should be extended to carefully specify the conditions and then evaluate the data set developed below. The following equations are included in one of the OSA papers and in the main treatise.
THE EQUATIONS OF VISION ARE LOGARITHMIC
BRIGHTNESS INVOLVES A LOGARITHMIC SUMMATION
R(l) = log #S d l + log #M d l +log #L d l (within adaptation amplifier range)
COLOR INVOLVES TWO LOGARITHMIC SUBTRACTIONS
P( l ) = log #S d l - log #M d l = log [ #S d l / log #M d l] – A log of a RATIO
Q( l ) = log #M d l - log #L d l = log [ #M d l / log #L d l] – A log of a RATIO
#X = EXCITATION (l) X ABSORPTION (l) IN PHOTONS PER SPECTRAL BAND
GAIN CONSTANTS OMITTED
R(l), P(l) & Q(l) ARE SCALAR NUMERICAL VALUES
P, Q & R ARE COMPUTED WITHIN THE RETINA
P & Q ARE THE THE TWO CHROMATIC OPPONENT AXES OF HERING (& MB-DKL)
THE LUMINANCE SIGNAL, R, IS COMPUTED BY BIPOLAR CELLS
THE CHROMINANCE SIGNALS, P & Q, ARE COMPUTED BY LATERAL CELLS
P, Q & R ARE INTERPRETED BY THE MIDBRAIN AND OCCIPITAL LOBES
THE VECTORIZED SIGNALS ARE:
As in the case of the MODELFEST activity, to place the COLORFEST activity in proper context within the field of vision, it is important to differentiate between the color contrast sensitivity of the system with respect to temporal frequency (cCTF) and spatial frequency (cCSF). Simultaneously, it is important to recognize the parallel luminance contrast sensitivity as a function of temporal frequency (CTF) and spatial frequency (CSF. The literature has not always clearly differentiated between these functions. On this page, and in the supporting material [17.1.2.3 & 17.6.3], a clear distinction will be made between these functions. It is also important to recognize the difference between chromatic contrast in object space and in electrophysiological space.
Merely defining cCTF and cCSF is not sufficient due to the way the fundamental P & Q signals are processed and the asymmetries in this processing. To be scientifically precise, cCTF and cCSF must be further subdivided to indicate both the axes along which the measurements were made and the direction of change in the stimulus.

Where the right matrix consists of the net coefficients applicable to the signal path between one of the photosensitive inputs and one of the signal processing channels. These coefficients are constant under photopic conditions. Although the value of the individual have not been determined independently, several specific solutions to these equations are known.
The middle matrix defines the excitation of the individual photosensitive channels. Note that the input stimulus, Ein(l) is common to all of the photosensitive channels but the integrals are channel specific based on their absorption coefficients, Ax(l).
* Outside of the photopic region, the form of the L-channel term changes.
The left matrix defines the signals formed at the pedicle of each signal processing channel neuron (either a bipolar or a horizontal cell). Several solutions to this matrix equation are known:
The static contrast between any two positions in color space can be determined by reading their coordinates from the P and Q axes of the NEW CHROMATICITY DIAGRAM for RESEARCH and differencing their p and q coordinates. Normally the static contrast is described by both a Dp and a Dq value.
When discussing the chromatic contrast versus frequency, the situation is much more complex. Each of the delta values is an asymmetrical function of frequency. While it is possible to speak of some root-mean-square value for a single chromatic contrast function for a signal alternating between two positions in color space, the concept is awkward. Scientifically, it would be better to determine the chromatic contrast senstivity function for each delta function. These functions are asymmetric and vary with position in color space. However, for low contrast inputs, they are relatively symmetrical at each location in the color space.
While isolating the above delta functions in electrophysiological experiments is relatively easy, the values obtained from the P and Q channels will depend strongly on the point of measurement, prior to or after the encoding employed to send signals over the Optic Nerve of Stage 3.
Isolating the delta functions in psychophysics experiments must be accomplished by controlling the input stimulus. This calls for very careful tailoring of the input stimulus to only introduce a Dp or a Dq without stimulating the other channel (or stimulating the luminance channel). Thus test signal pairs must be employed where both lie along either the violet-yellow or the aqua-pink axis. While this can be easily accomplished with tricolor monitors, such experiments have not been reported in the past literature.
[Merely switching between the individual phosphors of the monitors does not create signals that lie along the above axes. All known previous experiments have involved signals, generally near the spectral locus, that have excited both the P and Q channels simultaneously. The response of the subject has necessarily been due to a composite P and Q channel stimulus (even though the experimenter described his stimulus as an "S" or a "L-M" stimulus. The response has often involved the stimulus of the R channel as well.]
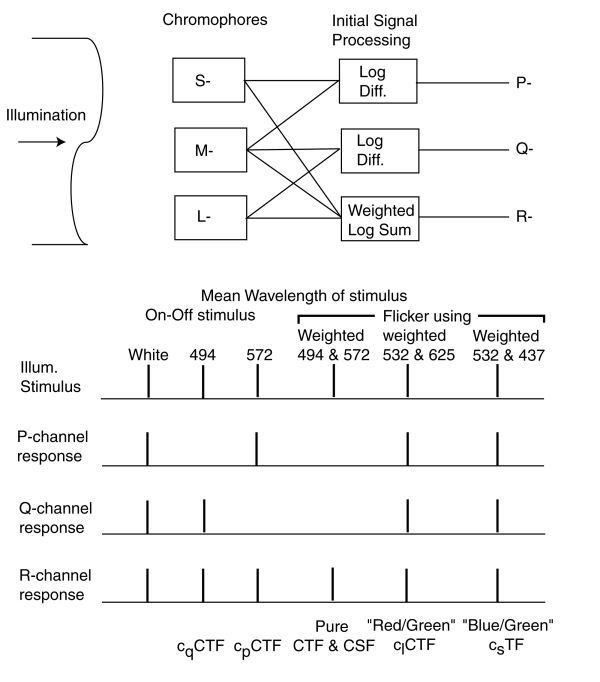
The following table of bar graphs illustrates how difficult it is to isolate only the P, Q or R channel using simple test stimuli. The only easily obtained pure contrast sensitivity functions are the achromatic contrast functions in the spatial and temporal domains, CSF and CTF (and these two precise functions have not been reported in the literature). Only composite functions have been reported based on "white light." These composite functions necessarily include chromatic factors related to the P and Q channels. The precise CSF and CTF functions are not asymmetrical in time or frequency. Note the functions labeled cqCTF and cpCTF actually contain variations in the luminance signal R as well as variations in either the Q or P signals. The conventional long wave difference, clCTF and short wave difference, csCTF are also composite responses.

To truly isolate the Dp and Dq chromatic contrast sensitivity functions, experiments must be carried out using pairs of stimuli that appear along one of the cardinal axes defined on this page. The intensity of the two stimuli must be adjusted to eliminate any response within the R-channel. This can be done by establishing their relative intensity according to the theoretical luminous efficiency function, R(l). At lesser precision, the approximate photopic luminous efficiency function of the CIE may be used.
The above time constants can vary from less than 75-100 milliseconds to as much as 1.5 seconds for very deep reds and blues (A feature exploited by magicians). A subject will report different results in chromatic experiments involving proportionately deeper reds and blues depending on the time interval of the stimulus. This effect should be anticipated in the design of any laboratory experiments.
Because the above time constants are asymmetrical with respect to the "white" point, even within the photopic range, the spatial variants of the color contrast functions are difficult to define precisely. Their precise definition requires quite advanced mathematical concepts (basically the Fourier Transform of an asymmetrical temporal response). The resulting functions exhibit both frequency and phase components.
As in the case of the achromatic contrast sensitivity functions, the MTF of the physiological optical system does not play a significant role in the chromatic functions.
The likelyhood of developing a complete family of precise chromatic contrast sensitivity functions in the immediate future appears remote. Therefore, it is appropriate to focus on the most useful functions. Determining the chromatic contrast functions in the temporal domain, cpCTF and cqCTF near P(494) and Q(572) respectively appears most useful. Under sufficiently small contrast conditions, these values will appear symmetrical. By incrementally increasing the contrast of the stimuli, the asymmetrical properties of these two specific contrast functions could be determined. The results of these experiments would allow the calculation of the chromatic color sensitivity functions along any set of axes passing near or through "white."
After determining the above temporal contrast functions, an attack on the chromatic contrast sensitivity functions in the spatial domain can be considered. This attack can be made more effectively after the degree of asymmetry in the temporal domain is understood.
Experimenters should take care to indicate whether their data applies to composite CTF and CSF functions (those involving the stimulation of multiple signaling channels) or applies to only one signaling channel.
The results of experiments can be presented using auxiliary axes and the NEW CHROMATICITY DIAGRAM as suggested in Section [17.3.3.3] of Processes in Biological Vision.
Three papers were prepared for the 2001 OSA Annual meeting that are relevant to chromatic contrast sensitivity. They were:
Parts of these presentations appear on this webpage. The complete text of these papers are available from VISION CONCEPTS via the COMMENT PAGE