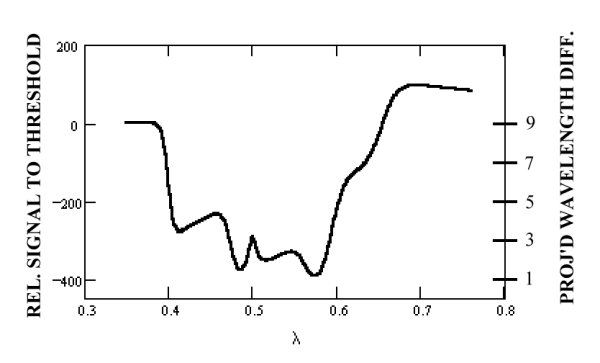
The following figure is presented here at reduced scale (resolution)to accommodate a browser. A version offering greater precision is available in Chapter 17 in the Download Files area reached from the Site navigation bar.

Spectral Threshold Function of the Human Visual System under photopic conditions [from Section 17.2.3]
The above figure describes the theoretical spectral threshold performance of the human eye with great precision. The curve describes the measured data of Pitt to a remarkable degree (well within a ± 2 nm envelope) and demonstrates the systematic deviations from a smooth curve in the measured data are not due to measurement technique.
The overall performance is computed from the signal to threshold performance characteristic of the P and Q chrominance channels individually followed by a merging of the curves. As best as can be determined, the merging occurs at a wavelength of 532 nm. The perceptual selection process appears to be based on a a maximum signal to threshold criteria (using absolute values in the above figure).
The above features are discussed in detail in Chapter 17.
Return to the website home page