The following figure:

The SENSATION SPACE OF HUMAN VISION [from Section 17.4]
is presented here at reduced scale to accommodate a browser.
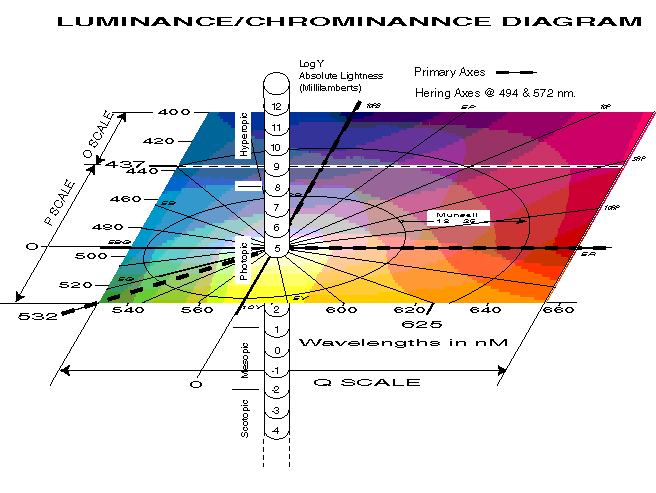
This figure presents the maximum theoretical envelope of the combined luminance/chrominance space of a long wavelength trichromat. The chrominance plane of the sensation space is shown overlaid by the Munsell Color Space. The luminance dimension is shown divided into the four regions of vision as defined in this work (see Glossary).
The actual volume within this space representing the actual instantaneous performance of the visual system is more limited as defined in various earlier adaptations of the Munsell 3D Color Space. The typical extent of the luminous intensity range of the visual system is two logarithmic units. The adaptation amplifiers are instrumental in selecting the desired range and converting it to the two logarithmic unit brightness range of the visual signal processing system.
A number of variants of this figure appear in the main text. They specifically define the trichromatic and the Hering axes as they appear in sensation space.
It is important to note that there is no direct theoretical relationship between the luminance axis and the chromatic plane of animal vision. The use of spherical coordinates is inappropriate under these circumstances.
The dashed line at 437 nm defines the transition between the nominal trichromatic space (below the line) of the human eye and the extended region associated with the truncated tetrachromatic space (above the line) of the human eye.
A larger scale version of this figure is available for download in Chapter 17, Part II, Section 17.4 via the Download Files area reached from the Site navigation bar.
Return to the website home page