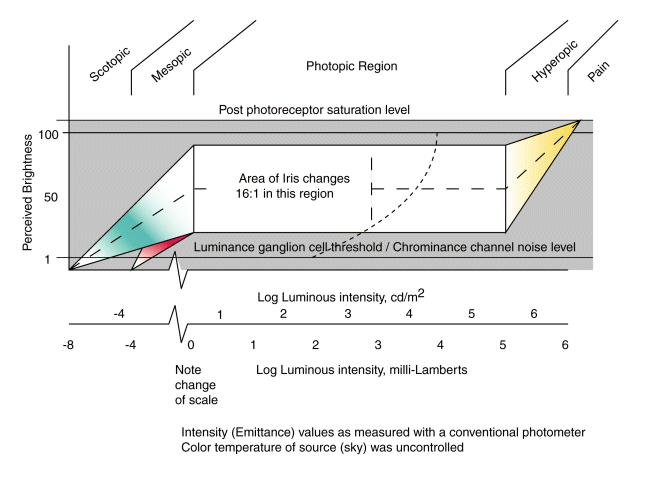
The following figure is presented here at reduced scale (resolution)to accommodate a browser. A larger scale version is available in Chapter 17 in the Download Files area reached from the Site navigation bar.

While the theoretical specification of the Luminous Transfer Function is straight forward, it involves a considerable number of parameters. The empirical measurement of the function is quite difficult due to the necessity of recognizing and/or controlling these parameters. An additional complexity is the difficulty the human has in uniquely separating his perceptions of brightness and chromaticity.
The above figure shows the perceptual capability of the human as a function of illumination using an uncontrolled source (a northern exposure to the sky with calibration by an unspecified photometer).
The ordinate is of low precision. The human eye typically exhibits an instantaneous dynamic range of less than 200:1 and the threshold for this range changes from a stochastic to a deterministic value depending on the illumination range involved. It is clearly stochastic in the mesopic region and probably the scotopic region (although the underlying sources of these limits may be different. In the photopic region, the limit appears to be deterministic.
The abscissa is of equally low precision. There is very little recent data encompassing the total illumination range of the human eye. The scale is taken from material from the 1950's reviewed in Section 2.1.1.
The mechanisms operating within the visual system do not correspond well with the definitions of the illumination levels developed in the literature. The mesopic region is a particular problem. Section 17.2.3.2.2 attempts to rationalize the limits of the individual mechanisms within the mesopic range and the range itself.
The chromatic range of the human eye is more limited than the achromatic range. This is illustrated in the lower left of the figure. All chromatic response is lost below 10-3 milli-Lamberts. This value defines the transition from mesopic to scotopic vision. As the scotopic region is approached, the human reports some residual chromatic sensations in the blue green after all response in the red region is lost.
The chromatic response of the human eye is also degraded at very high levels. The hyperopic region is characterized by a loss in chromatic saturation and the appearance of the Brezold-Brucke phenomenon. This phenomenon represents a saturation in the M-channel sensor response that accentuates the perceived sensitivity in the region near 487 and 580 nm. A subject generally reports a yellowing of the scene.
The region of color constancy lies between about 1 and 3,300 milli-Lamberts (3 and 10,000 cd/m2).The dashed line indicates the average luminous transfer function between object space and perceptual space in the absence of any large signal information. The combined effect of the iris and the adaptation amplifiers is to maintain a constant level of perceived response over an illumination range of approximately five orders of magnitude. This range is known as the photopic region of vision. The adaptation amplifiers alone account for about three and one half orders of this range. Within this range, the eye acts as if the average input illumination was fixed.
The curved dotted line represents the instantaneous transfer function between object space and perceptual space. This curve can move horizontally within the photopic region as a function of the adaptation process. The information content of the scene is usually grouped around the average illumination level and the contrast of the information is usually low. Thus, no matter what the average illumination level of the scene, the signal information is found to reside within the dynamic range visual system.
The above features are discussed in detail in Chapter 17. Background information on radiometry appears in Chapter 2, Section 2.1
Return to the website home page