There has been little discussion of the theoretical foundation of the dark adaptation process beyond the conceptual. Hecht provided a low and high envelope of his recorded data during the 1930's. These envelopes have been interpreted ever since as consisting of two exponential functions, even though it is widely recognized that the two branches of each envelope were not described by an exponential equation. It is extremely difficult, mathematically, to define a function that is continuous in time and displays two branches that are each exponential like.
This work has defined the fundamental parameters responsible for this phenomenon and solved the relevant equation. The phenomenon is based primarily on three parameters.
The phenomenon is particularly difficult to
describe succinctly for three reasons;
The following figure describes the complete dark adaptation characteristic in detail. This version is a caricature to better illustrate the complete situation. It includes several additional short time constants that are not normally highlighted in discussion of dark adaptation. The curves have not been normalized in amplitude.

Curves A through E represent ever decreasing stages of initial light adaptation relative to the fully dark adapted condition. In condition E, the eye was nearly fully dark adapted at the start of the experiment. Although there is a delay in the start of adaptation due to the P/D Process, the only apparent time constants are those associated with the impedance attached to the collector terminal of the adaptation amplifier Activa and the nominal operation of the pupil. Under condition D, the time constant associated with the variable impedance of the Activa collector itself becomes evident. The major feature of curves C through A is the underlying exponential curve(shown in red). This function is exponential with reference to the right hand scale but not with respect to the left hand scale for reasonable levels of light adaptation prior to the dark adaptation experiment. Under condition C, the basic exponential function begins to show a small sinusoidal modulation due to the limited ability of the metabolic system to respond to the increased current demands of the adaptation amplifier. Condition B places a more significant demand on the metabolic supply. In response, the overall characteristic now shows a significant inflection in the region of 12-13 minutes after cessation of illumination and the resultant sinewave modulation of the basic exponential becomes more obvious. This inflection due to the modulation is more prominent under condition A and a second inflection becomes apparent near 24-26 minutes into recovery. Although the experiment is seldom performed for such an extended period, additional inflections will be seen at multiples of 12.5 minutes for up to a day in cases of serious snow blindness. In condition A through D, it is the change in the internal impedance of the adaptation amplifier collector impedance that is dominant and accounts for the majority of the amplitude change. However, it is the impact of the limited capacity of the metabolic system that causes the feature near 12 minutes (and again near 25 minutes)into the adaptation process. This modulation of the underlying exponential function is not recognized in the conventional adaptation diagrams.
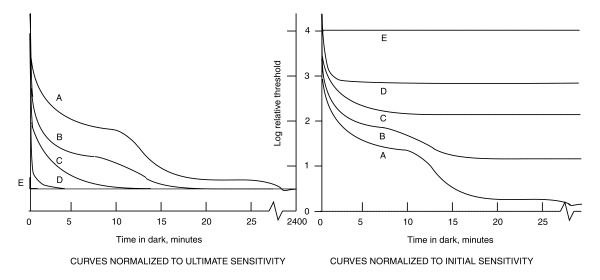
When attempts are made to replot the above caricature in a normalized form and using a single uniform time axis, important features are lost. In addition, there is more than one way to normalize the family of curves. One way is to normalize with respect to the starting condition. This is the conventional way. The other way is to normalize with respect to the terminal condition. This method provides more insight to the underlying processes. The following figure compares these two methods using caricatures.

The presentation of dark adaptation on the right, attributable to Wald, lacks relevance to the actual situation. It fails to relate the fact that the ultimate sensitivity of all of the cases are the same.
On the other hand, the presentation on the left, attributable to Hecht, clearly represents the fact that the changes in gain related to the different cases increases dramatically going from E to A. It also clearly indicates that the ultimate sensitivity of the system after complete dark adaptation is the same regardless of the beginning state.
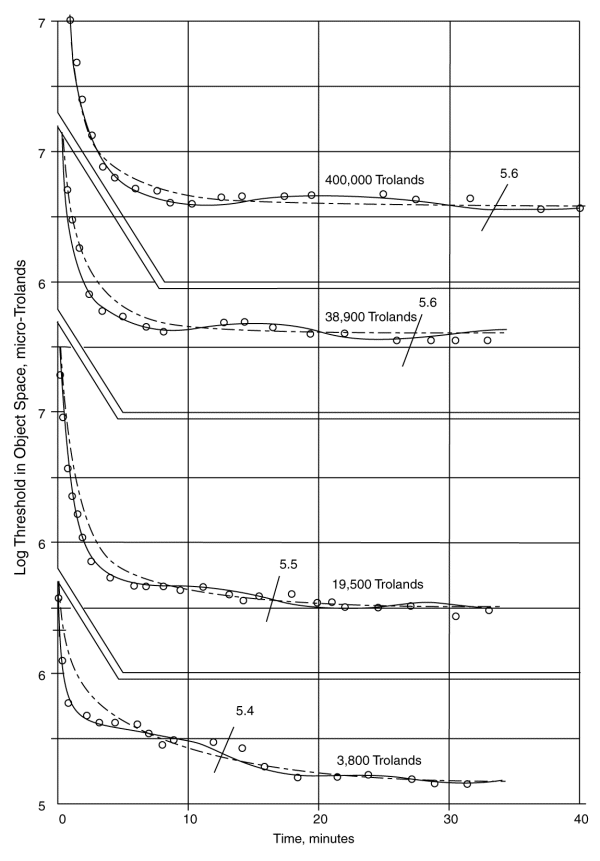
The following frame shows how well the proposed theoretical second order function tracks some of the data of Hecht.

The data is plotted in a framework first used by Hecht to save space. The dash-dot lines are the theoretical function without sinusoidal modulation. The solid lines represent the theoretical representation corresponding to the data points of Hecht. Note how well the proposed theory matches the data of Hecht in the interval corresponding to 25 minutes after the cessation of illumination. No other recognition of (or attempt to account for) this feature has been found in the literature.
The slash lines and numbers indicate the point where Hecht claimed the individual lost all chromatic sensation. This value remains essentially unchanged regardless of the initial state of adaptation (within a factor of 0.2 log units in spite of an initial state change of over two log units). Note that based on this theory, all of the curves would converge on an ultimate dark adaptation threshold of 5.2 micro-Trolands after a sufficient interval and all chromatic sensation is lost near 5.5 micro-trolands due to chrominance signal to threshold limitations for the spatial size of the test illumination used in these experiments.