The following figure is presented here at reduced scale (resolution)to accommodate a browser. A larger scale version is available in Chapter 17 in the Download Files area reached from the Site navigation bar.
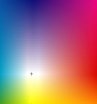
 Combined Chromaticity and Munsell Color Diagram, copyright 2000 James T. Fulton
The above figure combines the NEW CHROMATICITY DIAGRAM FOR RESEARCH with a specific variant of the Munsell Color Space Diagram. The details concerning the definition of the New Chromaticity Diagram are given in the above reference and will not be repeated here.
The Munsell Color System was developed early in the 20th Century and was renotated in the 1950's in an attempt to rationalize it in terms of more recent color investigations. The system is based entirely on observations under controlled (originally natural) illumination and contains no reference to any spectral wavelength.
To prepare an overlay of the Munsell Color System onto the New Chromaticity Diagram, some assumption must be made about the chromatic content of at least one non-white "color" in the Munsell color space. The easiest assumption would be to estimate the color in the yellow corresponding to 572 nm and or the blue-green corresponding to 494 nm. For purposes of this initial work, it was assumed that the Munsell 5BG-5R axis corresponds to the P= 0 axis and the Munsell 10Y-10PB axis corresponds to the Q = 0 axis.
With the above assumption, the Munsell Color Space can be overlayed onto the New Chromaticity Diagram for Research quite successfully. There is a problem in that the Munsell colors are defined for the spaces between the axes instead of on the axes. However, Munsell "red" does straddle the 5R radial and Munsell blueish-green (defined here as Azure) straddles the 5BG radial. The Munsell greenish-yellow straddles the 10Y radial and Munsell violet straddles the 10PB radial.
With the Munsell space oriented as suggested above, the radial 3G passes most near the 532 nm spectral corner of the New Chromaticity Diagram. 3G is normally listed as the border between Munsell green and yellowish-green. Yellowish-green contains more green than yellow-green in the Munsell notation.
The Munsell color names change slightly relative to the radials with perceived brightness. However, this change appears to be a minor problem.
Adopting this orientation between the two diagrams, the Sodium D2 line (589 nm.) appears at the intersection of the Munsell 3Y radial (at a saturation of about 20) with the spectral locus.
The overlay as defined completely accounts for the observed ability of the visual system to achieve higher "saturations" in the 2nd and 4th quadrant, and to reach maximum saturations in the 1st quadrant of the figure. No other theory is even known to address this feature of the visual system.