
There must be a distinct line between the medical and biological aspects of syndromes as serious as achromatopsia. This material should not be considered medical advice. Subjects aware of this syndrome should speak with their doctor. This webpage does not offer any alleviation of these symptoms in the near future.
Because of the currency of some of the material presented below, students subject to rote testing based on the content of their textbooks are encouraged to review the Cautions Page before proceeding. Others may find the material controversial. However, the results speak for themselves.
Achromatopsia (with an s) is a stationary congenital syndrome that is easily recognized in the clinic. It typically presents five different individual symptoms:
Each of the above symptoms may appear independently and without association with Achromatopsia. In such case, they may be caused by other underlying disease. Abnormal iris operation is common but frequently undocumented.
A sixth symptom is generally associated with the nystagmus but is seldom documented. Because of the nystagmus, the vergence system does not achieve stereopsis. As a result, the subject may be completely unfamiliar with the perception of depth in imagery and even the concept of three dimensional vision. Brief comments on this condition are available at astereopsis
A single point failure is the most likely cause of this disease. However, recent work has defined more than one form of the disease.Recently there has been increased activity related to Achromatopsia. This has been caused by the increased capability of people to communicate over the Internet, recent televison programming and the progress in genetic analyses. This page offers, in conjunction with the parent site, PROCESSES IN BIOLOGICAL VISION, some additional insights into the subject. It also attempts to add additional precision to the nomenclature used in this area.
This webpage will concentrate on the following areas.
A formal presentation describing Achromatopsia was given in Dallas, Texas on 3 July 2008 to the Achromaopsia Group under the auspices of the National Federation of the Blind. This presentation is available on line.
Addresses for contacting the author are provided at the end of this document.
Return to the NEURON Home Page . Return to the website VISION home page
The scope of the available clinical information about achromatopsia remains quite limited in spite of the recent attention related to the people of Pingelap Atoll in the Southwestern Pacific Ocean. This situation is related to its rarity in the general population. The available physiological data is even more limited. The most thoroughly studied case of achromatopsia is actually that of a subject in Scandinavia who was also a research scientist. Fortunately, the recent advances related to genetics are significant.
Following a preliminary Ophthalmological expedition to the Pingelap Atoll reported in 1970 (Brody, et. al.), a more extensive investigation was carried out and reported in 1972 (Carr et al.). [References are provided at the bottom of this webpage]
The first expedition was quite limited in the scope of their investigation due to the primitive conditions on this minor atoll. Testing was limited to simple Snellen E-charts, Ishira color plates and manual estimates of the peripheral vision of a group of subjects with obvious symptoms of the syndrome. They noted the presence of several common components of the syndrome, photophobia, achromatopia and nystagmus. They also noted the apparent genetic nature of the syndrome. This resulted in a major study of this isolated population in the genetics community that appears to have been immensely successful from a research perspective (Sundin et al.). The study has not yet provided any treatment for the syndrome. The second expedition was able to carry out a wider variety, but still less than comprehensive range, of tests using primarily field compatible equipment. This study did note the additional high incidence of myopia and a high frequency of pupil abnormalities among the subjects and it also obtained ERG recordings under less than ideal conditions. The Carr et al. report details this additional information. It does not address the distinction between correctable refractive myopia and uncorrectable neurological myopia.
Neither of these expeditions reported in detail on the state of achromatopia or the degree of trichromatic anomaly of the group or individual subjects. No results of tests to determine the spectral sensitivity, the so-called luminous efficiency functions, of the subjects was reported. Neither were any anomaloscope measurements, collected and presented in the manner reported in 1969 (Lakowski, page 278), made on either the most severely affected subjects or their sibling and relatives. Lack of spectral data, anomaloscope data, and more precise ERG data constitute a serious shortfall in the investigations to date.
During the last few years of the 20th Century and continuing to this day, a more significant effort has been made to identify the disease in peopoles of other locations, particularly in Europe.
Through the assimilation of a large amount of historical information and geneology, the genetics community has been able to trace the syndrome back to the apparent founder in the case of the Pingelapese population. It has been traced similarly in several other isolated communities and a number of individual families. Combined with the recent work in genomics, the efforts have actually isolated two genes that appear to play a major role in the syndrome.
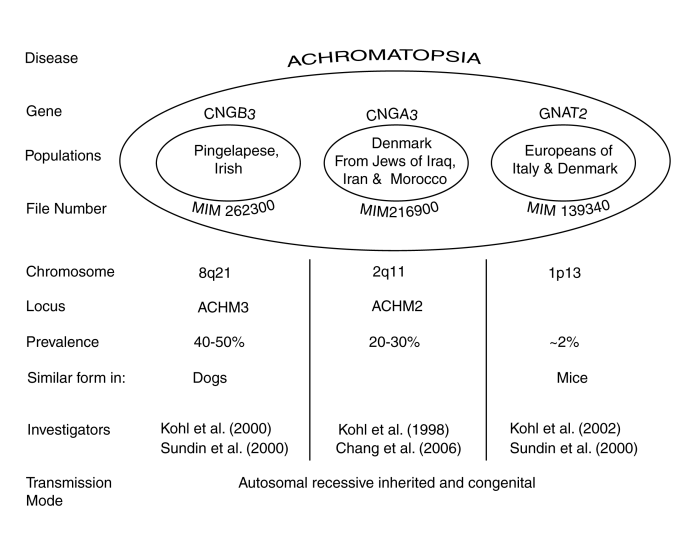
The following figure attempts to summarize what is known about the overall condition of Achromatopsia based on genetic studies. Details are available in the papers cited and in Section [18.8.2].
The disease has now been found to occur in three genetic forms, with further subdivision among some of the forms. The recently identified form, labeled GNAT2, provides significant new insight into the disease but only occurs in a small portion of the cohort population. The population labels are only suggestive because of the intermixing of cultural groups over the last several hundred years.
The authors of the above genetics-based papers have offered their explanation of the cause of Achromatopsia based on their reading of the conventional wisdom. This wisdom assumes that there are functional rods and cones based on the presence of morphological structures labeled rods and cones. This interpretation requires the presence of a broad band visual spectrum absorber in the rod form of photoreceptor. No photoreceptor with this characteristic has ever been recorded by means of electrophysiology. Sundin et al. only draw the inference that the source of the disease is within the photoreceptor cells of the eyes. Kohl et al. make more specific claims but provide no substantial references or arguments supporting their position.
On the physiological side, the syndrome is less well understood. The conventional wisdom is that the subjects studied have lost all visual sensitivity related to the chromatically sensitive photoreceptors (misleadingly described as cones) of the visual system. As a result of this loss, the conventional wisdom is that the remaining photoreceptors, historically called rods are the only remaining active photoreceptors in this syndrome.
It can be shown that these morphological names have negligible relationship to the electrophysiological performance of the visual system. It is preferred that the photoreceptors be described in terms of their individual spectral response. In this paper, those photoreceptor names will refer to their respective short, medium and long wavelength spectral response. In the vernacular, these are called blue, green and red. However, those are imprecise descriptions.
In the material presented on the main website, it is shown that the morphological term rod plays no role in the physiology of vision. It is also shown that there is no requirement for a broad spectral band photoreceptor to explain the performance of the visual system.Knut Nordby, arguably the most famous achromat in the world, was diagnosed as a complete achromat many years ago. The alternate name associated with the syndrome and still associated with it to this day was rod monochromacy, on the assumption that the subject had a much narrowed spectral response characteristic similar to the scotopic spectrum of a normal person under low light conditions. However, it was later found to the perplexment of the investigators that Mr. Nordby had a normal photopic luminous efficiency function and several other characteristics associated with functional trichromats [18.8.2.1]. This fact is a key to understanding the syndrome of achromatopsia.
Both the medical and physiological communities have made great progress in relating the conditions of the syndrome to specific functional areas of the visual system. However, they have not yet made a demonstratable connection between genomic mutations and the actual physiology of vision. No technical explanation for the cause of the photophobia, nystagmus or pupil operating abnormalities have been offered. The ERG records have been analyzed against an available database but the reason for their abnormality has not been offered. The next section will attempt to provide a broader perspective related to this syndrome.
This section will present a simplified explanation for the major functional abnormalities associated with the clinical condition known as achromatopsia. It is hoped that this material will aid future investigators, both clinical and research, define the loci of this syndrome more precisely. It will be impossible to explore all elements of the model on this site. However, the main site can be accessed and the author welcomes any comments, corrections or inquiries.
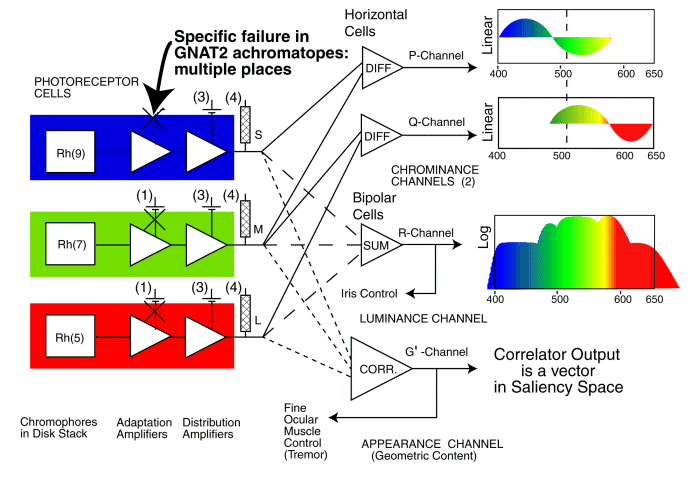
An OVERALL BLOCK DIAGRAM of the Human Visual system is available on this site. A simplified Block Diagram pertinent to the syndrome of achromatopsia is shown below. It omits many other visual functions not directly related to achromatopsia.
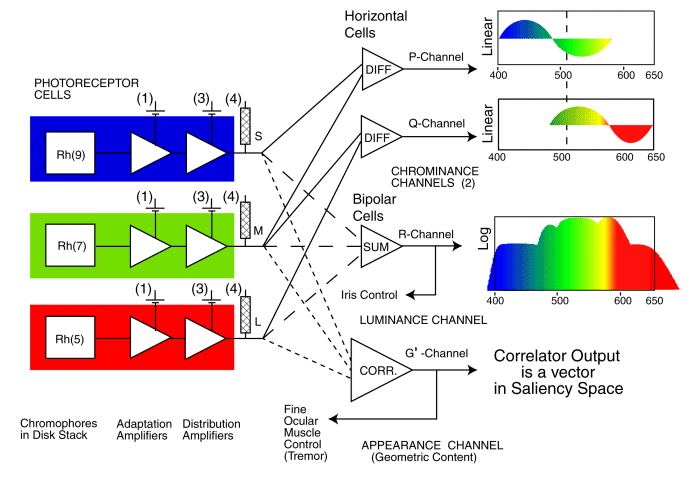
This figure shows the photoreceptors associated with the three individual spectral channels of human vision on the left. Each photoreceptor consists of an outer segment that contains one of the three light sensitive chromophores of normal vision,labeled Rh(x) here. This material absorbs light and generates an excitation that stimulates the input to the first amplifier shown. This is the adaptation amplifier found in each photoreceptor cell. It operates in conjunction with the second amplifier. It is this second amplifier that acts as the distribution amplifier that drives the multitude of signal processing neurons following the photoreceptors. There are many individual batteries associated with each photoreceptor cell. Those labeled (3) & (4) may be unique in the neural system. All of these particular batteries are thought to be identical. Those labeled (4) determine the cutoff potential of the axoplasm at the pedicle. Those labeled (3) determine the quiescent current through the distribution amplifier and therefore determine the quiescent potential at the pedicle under dark adaptation. Only the connections to the relevant signal processing neurons (performing differencing, summing and correlating) are shown here. Each signal processing neuron also contains an electrolytic-based amplifier similar to those in the photoreceptor cells.
The signal processing to the right of the photoreceptor cells are key to the next level of understanding of achromatopsia. It can be described in terms of three separate functions as shown.
The central path on the right shows how the signals from the spectrally specific photoreceptor cells, the S-, M- and L-channels, are collected and summed in order to form the luminance signal (labeled R in this work) which is then transmitted to the ganglion cells and the optic nerve. This summation is believed to also support operation of the iris of the eye as part of a closed-loop servomechanism. It is this summation that results in the luminous efficiency function of vision. All of the spectrally selective photoreceptor of vision are operative in a subject who exhibits a normal luminous efficiency function, at least at lower photopic illumination levels. A failure along this path can affect the luminous performance of the visual system as well as the operation of the iris. If the failure includes saturation within the channel, the subject frequently encounters a complete loss in scene contrast and may describe the process as a complete "wipeout of vision." Photophobia is an attempt to avoid this wipeout and maintain useful levels of vision.
The upper paths on the right show how the same signals from the spectrally specific photoreceptor cells are collected and differenced in pairs to form two distinct chrominance signals (labeled P- & Q-channels in this work) which is then transmitted to the ganglion cells and the optic nerve. A failure along one of these paths causes the common red-green and blue-yellow forms of color blindness. A failure along both of these paths results in achromatopia.
The path on the lower right shows how the same signals from the spectrally specific photoreceptor cells are collected and applied to a 2-dimensional correlator in the process of analyzing the information in the scene presented to the retina. The resulting signal is labeled G (for geometric) in this work. This correlation is carried out within the Precision Optical Servomechanism System (POSS) of the midbrain portion of the visual system. It is the POSS, parts of which are also known as the Auxiliary Optical System, that is responsible for two things, analyzing and extracting information from the signals from the foveola and steering the eyes to aid in this information extraction process. Those signals extracted to steer the eyes, as well as others obtained from the cortex of the brain, are fed back to the muscles of the eyes (the G'-channel) to form the closed-loop servo system of vision shown in the Block Diagram. A failure in this path leads to nystagmus and frequently to poor acuity that is uncorrectable (independent of the state of the physical optics of the eyes).
Each of the signal paths defined above can and does fail. Each failure results in a disease with a group of specific symptoms. Multiple failures generally lead to a clinically recognized syndrome of diseases. This is the case for achromatopsia.
Starting with the center path, a complete failure in this path to the brain is rare but it is recognized. The subject is unable to perceive objects but reports seeing moving shadows and colored areas lacking definition. There is also an infrequent failure in the servomechanism controlling the operation of the iris. It is generally not a significant failure because the range of operation of the iris is small compared to the dynamic range accommodated by the adaptation amplifier described above.
Failures in the chromatic paths are more common and well characterized. A partial or complete failure in the Q-chrominance channel is the most readily recognized and therefore most reported. It results in a variety of clinical conditions associated with "red" and "green" vision, e. g. protanopia and deutranopia. and what has been called blue channel monochromacy. A partial or complete failure in the P-chrominance channel results in a similar set of clinical conditions involving the "blue" and "green" channels, e. g. tritanopia and tetranopia. These losses are much less obvious in everyday civilized life and are frequently overlooked by the subject.
There are a series of more serious failures involving the loss of both signal paths associated with a single chromatic channel. A loss in both the "blue" and "green" channels leading to the differencing amplifiers results in "red" channel monochromacy (Extremely rare if ever recorded). Similarly, a loss in both of the "green" and "red" signal paths leading to the differencing amplifiers results in "blue" channel monochromacy (similarly, extremely rare if ever recorded).
There are a wide variety of failures that can occur in the analytical G'-channel. The principle one of interest to achromatopsia is the failure of the forward signal path of the POS leading to the correlation function. As a result of this failure, an open circuit in the closed-loop POS system is created. In the absence of the feedback associated with this signal, the correlator sends erroneous signals to the eye muscles and nystagmus results.
The principle interest, in the syndrome known as achromatopsia, is a failure in all of the signal paths shared by the chrominance channels, the luminance channel and the servomechanism associated with the analytical channel. Such a failure results in photophobia, achromatopia (no s), nystagmus and iris malfunction.
Any single point failure that affects all of the photoreceptors equally can lead to all of the symptoms associated with achromatopsia. Such a failure point may not be obvious from the above figure but it is present in the circuit diagram. The cause is a neuropathy of the photoreceptor cells as a group.
The following figure illustrates the detailed electrolytic circuit diagram of each of the photoreceptor cells [10.8.7]. They only differ by the chromophore found in their associated outer segment (or disk stack). The jagged line represents the resistance of the surrounding electrolytic media, the Interphotoreceptor matrix (IPM) and the Inter Neural Matrix (INM). The vertical dashed line represents the insulating biological barrier known as the Outer Limiting Membrane. Note the electrical terminals of the inner segment of the photoreceptor cell are in the IPM and the pedicle electrical terminals are in the INM. This is important in interpreting the a-wave and the b-wave of the ERG recordings.
Each of the amplifiers of each photoreceptor cell is fed by multiple independent power sources. However, the electrical sources associated with the same function in each cell are likely to share a common genetically controlled electrostenolytic mechanism. The question is can the specific electrostenolytic mechanism be identified. The available ERG records are crucial to this identification. The circuit labeled (4) can be considered a pull-up circuit. It consists of both a battery and a load impedance (in this case a diode). The battery labeled (3) determines the quiescent pedicle potential in darkness and the maximum current that can be accepted from the adaptation amplifier. The battery associated with the impedance labeled (1) detrmines the gain of the adaptation amplifier.
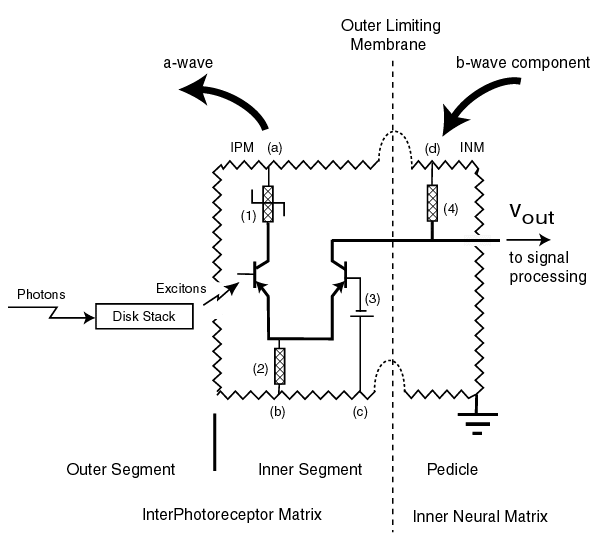
The electrical circuit associated with the left Activa is the adaptation amplifier of the cell. The electrical circuit associated with the right Activa forms the distribution amplifier feeding the signal processing circuits. It is the currents and potentials in these circuits, plus those of the signal processing neurons, that are recorded by the ERG [17.6.2]. The irregularities in the ERG's of the subjects with achromatopsia allow us to determine the precise point of signal path failure. The large arrow on the left represents the current forming the a-wave of the ERG. The large arrow on the right is related to the major feature known as the b-wave. Carr et al. noted the abnormality of the b-waves in their subjects while the a-waves appeared at least relatively normal.
The following figure illustrates the operation of the photoreceptor cell under a number of conditions.
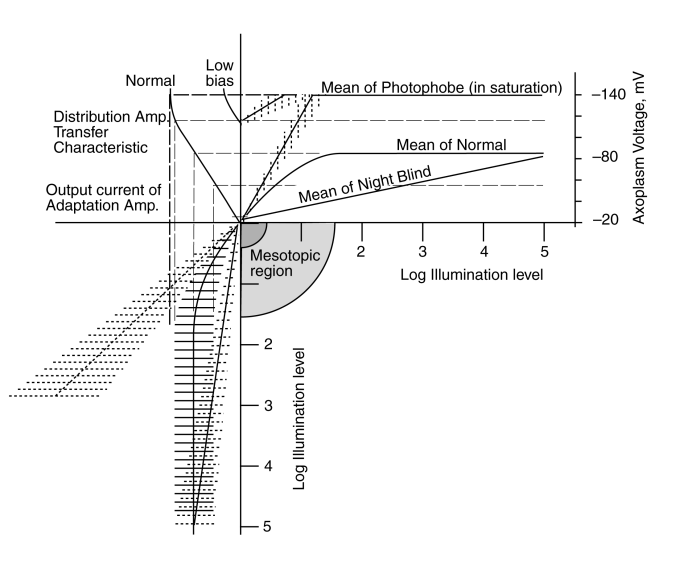
The solid herring bone at lower left shows the output signal at the emitter of the adaptation amplifier when operating normally. The mean of the herring bone describes the average output current and the ribs represent the signal variation caused by the contrast in the original scene. At low level, the mean is changing rapidly with input light level. This provides maximum sensitivity in the system. However, as the input illumination rises, the adaptation mechanism decreases the gain of the circuit. The result is an average output current that remains constant as the illumination increases. Under this condition, the output current is transformed into an output voltage by the distribution amplifier as shown. Both the DC and AC components of the output voltage correctly represents the input scene contrast at all light levels.
Two failure modes can still be identified in this situation. First, if the adaptation mechanism fails, the average and deviation in the signal current is shown by the straight dashed herring bone on the left. As a result of this failure, the output current of the amplifier is no longer compatible with the transfer characteristic of the distribution amplifier. As a result, the output voltage of the distribution amplifier resulting from this failure rises rapidly at first but reaches a saturation level. As the illumination continues to rise, the saturation in the transfer characteristic essentially erases all information associated with the scene (a condition described as wipe-out).
The second potential failure would relate to the battery labeled (3). If this battery voltage was reduced, the scale of the transfer characteristic would be reduced as shown by the characteristic labeled "low bias". This would change the operating voltage range at the pedicle and the input current range at the emitter of the distribution amplifier Activa. It may be important to note that the electrostenolytic process represented by battery (3) is apparently unique to the photoreceptor cells.
Either of these failures can cause the subject to exhibit a total loss of visual acuity at light levels above the mesotopic level. As a result, the subject exhibits photophobia under photopic or higher light levels but is perfectly happy when exposed to mesotopic light levels. The reduction in the electrostenolytic potential (3) most closely matches the conditions discussed below.
The following figure shows the predicted peaks in the portion of the b-wave due to the photoreceptor cells under these two failure scenarios. The s-shape traces represent the maximum and minimum excursion of the b-wave for a stimulus varying in contrast by about 2:1 at the specified light level. The solid lines represent the normal operation of the phtoreceptor cell versus illumination level. The dashed lines represent the operation under the neuropathies described. While the s-shaped characteristic cannot be achieved easily using a single excitation pulse shape, it is easy to create graphically from a series of stimuli varying by only a factor of 2 about the nominal illumination level.
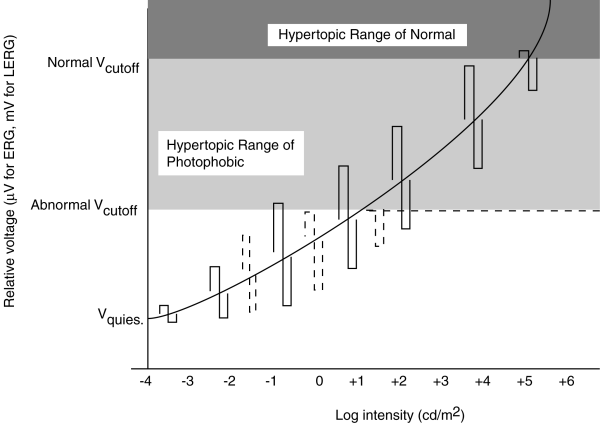
ERG of Achromatopsia and Normal compared. S-shaped figure is constructed from two related stimuli at each illumination level. Dashed lines represent the performance of sufferers of achromatopsia.
For the normal subject, the difference between Vcutoff and Vquiescent is normally about 20 mV measured by LERG (less using the noninvasive ERG). For a contrast of 2:1, the voltage amplitude of the resulting signal is small in the scotopic range, becomes constant over the normal photopic range and encounters limiting in the hypertopic range.
Biel et al. documented the a-waves and b-waves in a family of specially prepared mice using stimuli covering the scotopic and mesotopic range. They say the filled triangles mark the beginning of the photopic range in mice. Their figure notes the normality of the a-wave in their mice expressing the CNG3 mutation. More importantly, they illustrate the abnormality of the b-wave.
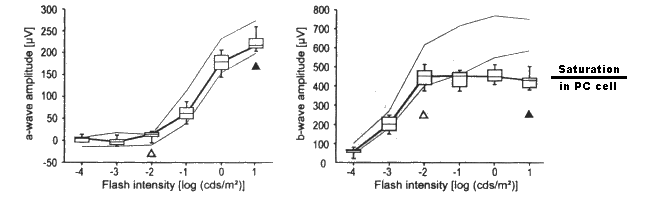
The a-waves and b-waves of dark adapted murine littermates. Left; the a-waves of four CNG3+/+ and four CNG3-/- mice. Right; the b-waves of four CNG3+/+ and four
CNG3-/- mice. In both cases, the light outer lines are the 5 and 95% quantile limits of the wild mice. Note the limiting of the b-wave to the right of the open triangle.
It is proposed that the laboratory results of Biel et al. confirm the neuropathy within the photoreceptor cells described by this theory. The single point failure is caused by a genetic error (associated with CNG3) that does not create the nominal -20 mV battery connected to the Activa base at location 3. The chromophores absorbing the light remain fully functional. This is a crucial observation that should be understood by the clinical community.
Recently, Chang has provided data similar to Biel for the GNAT2 genetic error. It shows the b-wave of the distribution amplifier working properly but a loss of signal that can be traced to the a-wave in achromatopes. The error appears to occur at location 1. The error prevents adequate electrostenolytic generation of current at the -154 millivolt collector terminal of the adaptation amplifier.
The single point failure location in the photoreceptor cells caused by a genetic error in GNAT2
The above figure highlights the location of the electrostenolytic error at the IPM/photoreceptor interface due to the GNAT2 genetic error. It is described as location 1 or (1) in the earlier figures. This error has apparently been overcome by Alexander et al. during 2007. In tests with mice, modified genetic material was injected into the retina and has apparently caused adequate energy conversion at the electrostenolytic site to cause a nominally normal a-wave in an ERG under photopic conditions.
A repeat of the experiments of Biel et al. under more controlled conditions can define which of the two possible failure modes described above is the ultimate source of the achromatopsia syndrome.
A comparative study of the chemistry within the inter photoreceptor matrix of sufferers and normals may define the specific electrostenolytic failure causing this disease [Section 8.6]. This analysis should be performed near the outer limiting membrane and adjacent to the photoreceptor cells [Sections 4.3.1-3].
A broader confirmation can be obtained by performing more controlled spectral sensitivity tests and other speciallized tests on a range of the subjects presenting achromatopsia and their siblings who show symptoms of achromatonamoly. The spectral sensitivitiy tests should be performed using light levels at the low end of the photopic range to confirm that their three spectrally selective photoreceptor channels are all operating properly, as in the case of Mr. Nordby.
Comments, corrections, etc. to the author by form, THE FASTEST WAY
Comments, corrections, etc. by routine E-MAIL
It is important to be clear in the definitions used in discussing the syndrome of Achromatopsia and the underlying functional condition(s). Some confusion arose following a recent television program where one speaker used a functional (physiological) description of a condition rather than the common medical (clinical) description that some of the audience expected.
Achromat is the vernacular for an achromatope, one who does not perceive color in vision. It has historically been assumed that the subject only had one type of operating photoreceptor cell. This remains the common wisdom today. This work does not support this view.
Achromatopsia (with an s) is a complex medical condition, labeled a syndrome, consisting of a number of commonly observed underlying individual conditions. See above. One of these conditions is achromatopia (without the s) that gives the syndrome its name.
Achromatopia (without an s) is a symptom of a functional disorder of the visual system characterized by a lack of any perception of color.
Achromatomalia (or anomalous trichromaticity) is an awkward word in English and the main reason for using the alternative. It is a functional disorder of the visual system characterized by an abnormal perception of color. It occurs in a variety of forms.
Acuity is a measurement of the ability of the visual system to perceive fine geometrical detail. The visual system is optimized for black and white imagery. The acuity for colored imagery is reduced.
Amblyopia-A neurological condition, associated with the Precision Optical System of the midbrain, limiting the acuity of vision in a subject. Frequently described in optometry as uncorrectable myopia.
Autosomal dominant inheritance (AD)Every generation is affected. Males and females are affected with equal frequency. The trait is transmitted only by an affected individual. Those without symptoms of the trait do not transmit it.
Autosomal recessive inheritance (AR)Only members of the same generation are affected. The trait is transmitted from asymptomatic carrier parents who each have one affected chromosome. Expression of the trait requires that both members of a chromosome be affected. Males and females are affected with equal frequency. Every child of an affected person is a carrier of the trait.
Electrostenolytic-Descriptive of an electrolytic process occurring on the surface of a cell membrane and capable of providing electrical energy to an electrical circuit.
ERG-- ElectroRetinoGraphy--A method of recording the bulk electrolytic (electrical) signals generated by the photoreceptors and other neurons of the retina without any invasive procedures.
Hyperopia-A clinical condition where the lens of the eye focusses the image in back of rather than on the retina. It is commonly called farsightedness.
Low Vision is vision uncorrectable to better than 20/70 (6/21)
Luminous Efficiency Function describes the sensitivity of the visual system as a function of spectral wavelength. The function varies continuously with light level but is usually defined for only two regions, the scotopic region and the photopic region.
Myopia-A clinical condition, commonly called nearsightedness and consisting of two components, refractive myopia and neurological myopia. Refractive myopia is the common form where the image is focussed in front of the retina. It is largely correctable with lenses. Neurological myopia is due to a failure in the precision optical system. This condition is currently uncorrectable. Uncorrectable myopia is frequently associated with Achromatopsia.
Neuropathy-A disease of the nervous system.
Nystagmus-A clinical term for motions of the eye(s)that cannot be controlled by the subject and that can be observed easily in the clinic. It occurs in a variety of forms. The primary pathological form is pendular nystagmus.
Photophobia-Literally, a fear of light. A clinical condition where the subject avoids intense light. There are two distinct categories of photophobia. In the first, the subject avoids viewing intensely illuminated areas because of physical pain associated with light reaching the RPE cells behind the retina. In the second, the subject avoids areas of relatively normal daylight illumination levels because it causes saturation in his signaling circuits. This causes a painless loss of scene contrast that can be described as a "wipeout" of all vision.
Rod Monochromat is a colloquial misnomer most closely identified with an M-channel monochromat which is virtually unknown. It has been used historically in clinical situations to describe intrinsic achromatopia or pentanopia (with induced achromatopia). (See table to follow)
Trichromat is an animal with normal color vision typified by the sensitivity of individual photoreceptor types to three distinct spectral wavelength bands.
Visual operating modes--There are four distinct physiological operating modes of the eye with respect to illumination. These modes are normally associated on a one-for-one basis with the illumination level of a scene. While this may be true for achromats and normals, it is not true for those with Achromatopsia. The four physiological levels are:
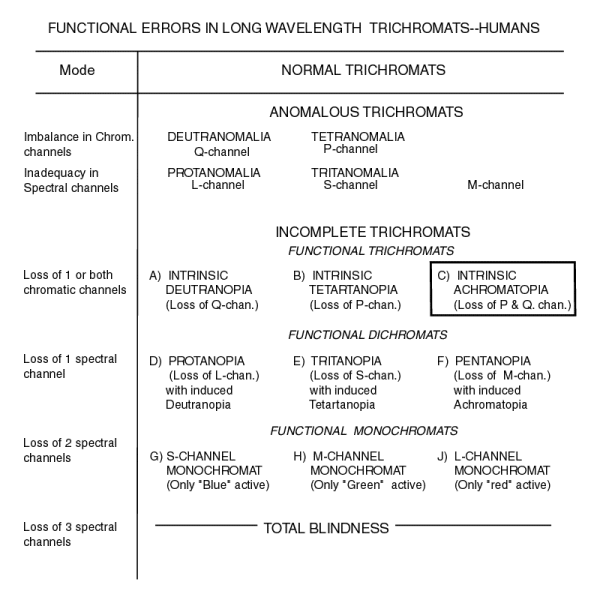
The discussion of colorblindness has traditionally used a single dimensional table (a list). A few authors have attempted to provide flow diagrams(Jimenes-Sierra et al.)but this has usually highlighted conflicts in the historical terminology. The following figure adds precision to the above terms by organizing them into a two dimensional matrix [18.1.2-1]. In this matrix, subjects defined as FUNCTIONAL TRICHROMATS, which includes those with intrinsic achromatopia, (the predominant type of achromatopes) are seen to possess the normal sensory capabilities of the functional trichromat but to not process the resulting signals properly. The letters in this table can be related to the OVERALL BLOCK DIAGRAM presented above.
Acland et al. (2001) Nature Genetics, vol. 28, pp 92-95
Alexander, J. Umino, Y. et al. (2007) restoration of cone vision in a mouse model of achromatopsia Nature Medicine May 21 Brief Communication in the 21 May edition.
Biel, M. et al. (1999) Selective loss of cone function in mice lacking the cyclic nucleotide-gated channel CNG3 Proc. Natl. Acad. Sci. vol. 96, pp 7553-7557
Brody, J. et al. (1970) Hereditary blindness among Pingelapese people of Eastern Caroline Islands. The Lancet, June, pp 1253-1257
Bennett, J, et al. (1999) Stable transgene expression in rod photoreceptor after recombinant adeno-associated virus-mediated gene transfer to monkey retina.
Chang, B. et al. (2006) Cone photoreceptor function loss-3, a novel mouse model of achromatopsia due to a mutation in GNAT2 Invest Ophthal & Visual Sci vol 47(11) pp 5017-5021
Carr, R. et al. (1971) Achromatopsia in Pingelap Islanders. American Journal of Ophthalmology. vol. 72, no. 4, pp 746-756
Jimenez-Sierra, J. et al. (1989) Inherited Retinal Diseases: A Diagnostic Guide. St. Louis, MO: C. V. Mosby
Kohl, S. et al. (2000) Mutations in the CNGB3 gene encoding the b-subunit of the cone photoreceptor cGMP-gated channel are responsible for achromatopsia (ACHM3) linked to chromosome 8q21. Human Mol. Gen. Vol. 9, no. 14, pp 2107-2116
Lakowski, R. (1969) Theory and practice of colour vision testing: A Review. Part I and Part II. British Journal of Industrial Medicine. vol. 26, pp 173-189 & 265-288
Nordby, K. & Sharpe, L. (1988) The directional sensitivity of the photoreceptors in the human achromat. J. Physiol. vol. 399, pp 267-281
Sundin, O. et al. (2000) Genetic basis of total colourblindness among the Pingelapese islanders. [Letter] Nature Genetics, vol. 25, pp 289-293