The patch clamp technique was introduced to biology initially by Cole in the late 1930's and was exploited by the Hodgkin & Huxley team in the late 1940's. The Hodgkin & Huxley conceptual model of the axon presented in 1952 was based on data acquired using this technique. Unfortunately, neither group presented a model of the complete neuron that supported their proposals. The technique has been applied widely since their time using a variety of modifications. All of these activities have been exploratory in nature. They have seldom included a theoretical model that they were attempting to confirm. The normal approach has been to attempt to extract a model, after the fact, from the data. This page will present the applicable theoretical and practical aspects involved in using the patch clamp technique
The following discussion appears in detail in Section 10.8.2 of Chapter 10 of PROCESSES IN BIOLOGICAL VISION. Download Chapter 10.
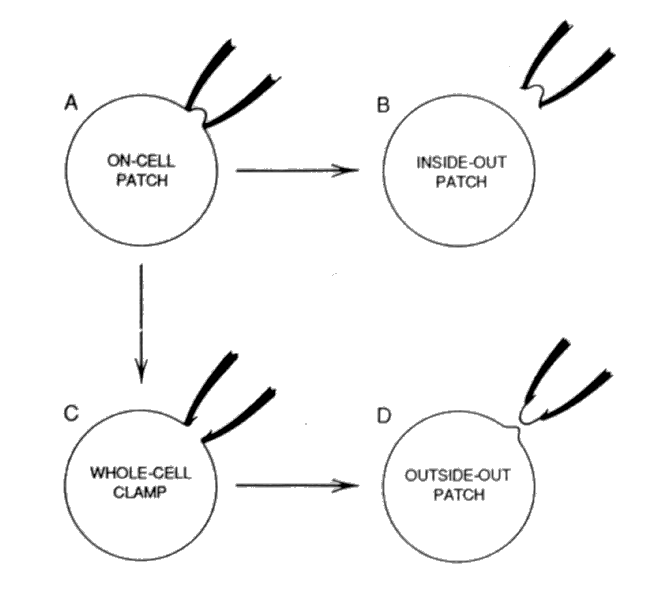
A variety of patch clamp approaches have evolved. The physical approaches are shown in the following figure.

Note that only the on-cell patch and the whole-cell patch are associated with the complete neuron. The others are only concerned with a portion of membrane. Only the whole-cell approach actually accesses one of the plasmas within the neuron directly. In the case of the on-cell approach, the impedance of the membrane must be considered in the overall test set design.
The electrical approaches center on the voltage clamp and current clamp configurations. These are frequently used in tandem to more completely evaluate the specimen under test. These experiments generally involve two time intervals. An initial period us used to allow the specimen to equilibrate prior to a sudden change in stimulus associated with the second period. However, as much information can generally be learned from the first period as from the second. This is because the first period usually involves clamping to a potential or current injection situation that does not corresponde to an operational state.
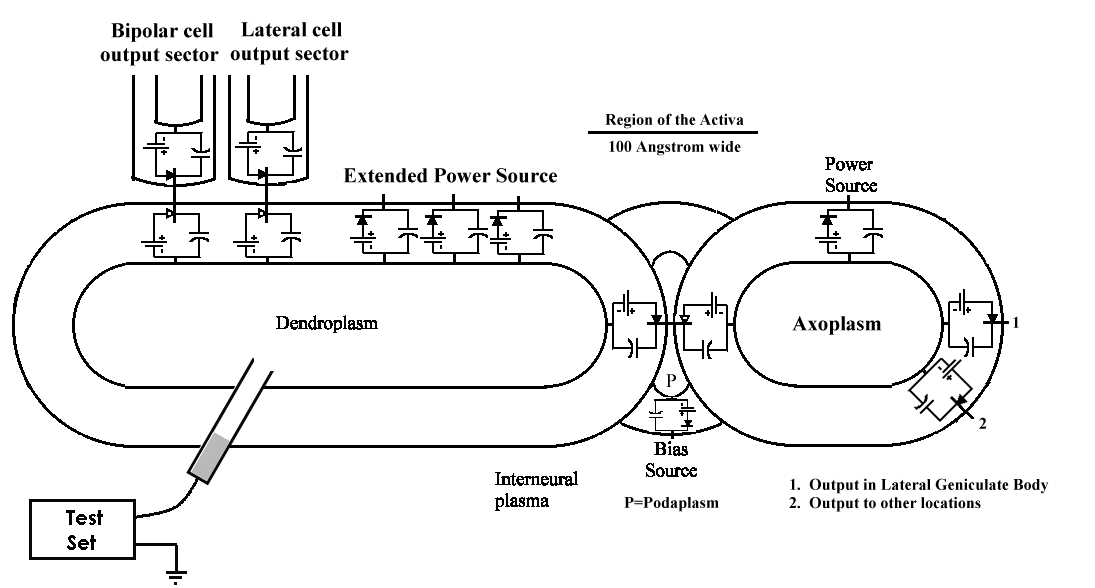
Although Cole and Hodgkin & Huxley focused their efforts on the giant axon of the squid, Loligo, their results were not typical of most neurons, and differed significantly from the results for myelinated axons as found widely in members of Chordata. Recent investigators have focused on the neurons of small mammals and from humans, obtained from surgical procedures. These neurons are drastically smaller than the specimens of the above investigators. As a result, most recent investigators have probed the soma of the neuron. Generally, they have made contact with the dendroplasm of the neuron as shown below for a ganglion cell.
References are provided below for some of the best available data. However, the reader is cautioned that these investigators were not aware of the actual electrical topology of the neuron they were evaluating. Hence, their interpretations of their results must be examined with caution.

The probe generally penetrates into the dendroplasm of the cell because it occupies the largest volume. The axon and the poditic terminals are quite small relative to the probe size. In some cases, the investigator has been able to penetrate into the axoplasm in the area of the hillock.
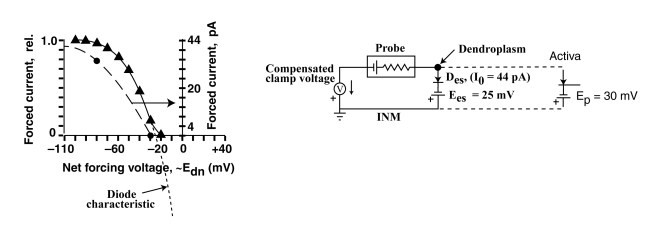
The exploratory nature of previous experiments can be seen in the voltages used to probe the neuron. When interfacing with the dendroplasm, potentials from -110 mV to +20 mV relative to the interneural matrix have generally been used. However, the Activa is only active for potentials more positive than -30 mV. Any data acquired in the -110 to -30 mV range only applies to the cutoff, nonoperational, neuron. Fortunately, this data is useful in determining the properties of the electrostenolytic source powering the dendritic portion of the neuron.

The above figure shows that the electrostenolytic supply to the dendroplasm consists of a -25 mV supply (note the polarity of the battery) in series with a diode. The electrical performance of the diode can be determined from its reverse bias saturation current, I0 (the maximum current achievable in the figure on the left). In this case I0 is 44 pA and is a function of the area of the type 2 biological membrane supporting the electrostenolytic process.
Notice the current departs from the theoretical curve in the region between -30 mV and -25 mV in the graph (triangles). This departure is due to the Activa beginning to conduct at -30 mV as shown on the right. -30 mV is the beginning of the operational range for this particular neuron. the range will extend up to about -20 mV at which the ganglion cell will begin to oscillate and generate an action potential.
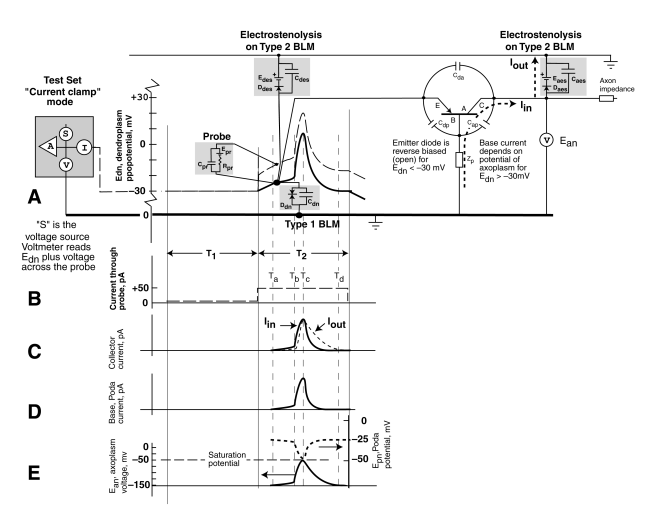
Following the operation of the neuron when connected to the patch clamp test set is difficult because of the complexity of the overall circuit. However, there is a graphical technique that aids in this process. It is normally used in electrical engineering when non-linear circuit elements are present. This is the case for the neuron. The technique is to plot the circuit elements directly onto the transient response of the circuit as shown below.

The explanation of this figure is too long to put here. See Section 10.8.2 of the main work, "Processes in Biological Vision." Download Chapter 10. However, it is important to note several features.
Hodgkin & Huxley were forced to hypothecate ionic currents through the axolemma alone because they artificially truncated their range of scientific investigation. They only considered currents passing through "external tissue" and overlooked the possibility of an Activa formed of "junctional tissue." No data has appeared in the last 50 years supporting their proposition that ions of sodium and potassium pass through the axolemma in support of the signaling function. The opposite is true. The axolemma itself, consisting of mostly type 1 and type 2 biological membrane, has been found to be impervious to ions. No gates have been identified by electron microscopy that provide passages through the membrane for ions.
Cole, K. (1968) Membranes, Ions and Impulses: A Chapter of Classical Biophysics. Los Angeles, CA: University of California Press
Hodgkin, A. (1951) The ionic basis of electrical activity in nerve and muscle Biol Rev vol. 26 pp 339-409
Kiernan, M. Baker, M. & Bostock, H. (2003) Characteristics of late Na+ current in adult rat small sensory neurons Neurosci vol. 119, pp 653-660
Ramo, S. & Whinnery, J. 1953 Fields and Waves in Modern Radio. NY:J. Wiley & Sons
Reid, G. Scholz, A. Bostock, H. & Vogel, W. (1999) Human axons contain at least five types of voltage-dependent potassium channels J Physiol vol. 518.3, pp 681-696
Suzuki, S. & Rogawski, M. (1989) T-type calcium channels mediate the transition between tonic and phasic firing in thalmic neurons Proc Natl Acad Sci USA vol. 86, pp 7228-7232
Taylor, R. (1963) Cable Theory in Nastuk, W. Ed. Physical Techniques in Biological Research, Vol. 6. NY: Academic Press
Return to the NEURON Home Page.
Return to the website home page.