
|
| ... | The SIGNAL PROJECTION STAGE of the NEURAL SYSTEM |
... |
This is the first of three closely associated pages discussing 1) the overall phasic stage (stage 3) of neural signaling, 2) the encoding of analog neural signals as action potentials and the resultant neural code, and 3) the recovery of the original analog signal from the encoded pulse stream (action potential stream).
This webpage hghlights the portion of the neural system involving phasic signal propagation (stage 3). While the neurons of stage 3 generating action potentials represent only a small number of the total number of neurons (about 5%), they play a major functional role and have been studied most closely (because of their ease of access and easily isolated signals).
Function is used here in the context of the underlying process of a given neural structure, and not as frequently found in neuroscience texts to describe the purpose of the structure.
Stage 3 neurons are found wherever signals are to be propagated more than a few millimeters. They appear to be an invention used primarily in and making possible the phylum of Chordata (colloquially the vertebrates).
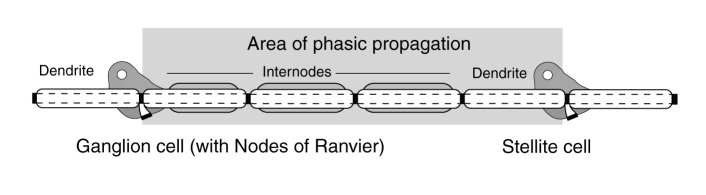
The following figure describes the stage 3 signal propagation circuit conceptually. It includes an encoding neuron described functionally as a ganglion neuron and a decoding (or signal recovery) neuron described as a stellite neuron. The ganglion neuron accepts analog signals and creates a phasic pulse train. The stellite neuron accepts a phasic pulse train and creates a copy of the original analog signal. To support signal propagation over long distances, the ganglion neuron incorporates signal regeneration circuits at intervals of about 2 mm. known as Nodes of Ranvier (NoR). The Nodes of Ranvier are functionally independent circuits incorporated morphologically into the ganglion neuron, and supported homeostatically by the soma of that neuron. Each internode of the ganglion neuron consist of regeneration circuit (NoR) coupled to a myelinated axon segment. Myelination is only used with stage 3 neurons. It is used to increase signal propagation efficiency from an energy conservation perspective. The dendrites shown in the figure are unmyelinated and generally much shorter than 2 mm.
The term stellite is used as the functional description of the decoding neurons of stage 3. It describes a large number of the morphologically defined stellate neurons and includes a majority of the large neurons of layer IV of the cerebral tissue.
Functional is used here in the context of the underlying process of a given neural structure,and not as frequently found in neuroscience texts to describe the purpose of the structure
The Electrolytic Theory of the Neuron can be used to represent the stage 3 signal propagation circuit using standard electronic symbology. The following figure shows such a stage 3 circuit. The circuit shows five active electrolytic devices (known as Activa) using the standard symbol for a PNP type transistor device. The active devices are shown incorporated in four different circuit configurations. It should be noted that all of the circuit configurations show the base, or poditic terminal of the Activa connected to the external neural matrix (generally through an impedance, P). This configuration is generally known as the common base or common ground configuration. This configuration appears to be used in all neural circuits, except for the second Activa in each receptor neuron.
The myelinated axon segments are shown as electrolytic elements exhibiting both capacitance and inductance distributed along their length. The presence of the inductance has been documented since the 1950's. This depiction replaces the conventional, and archaic, representation showing a capacitance and resistance distributed along the axon segment. The inductance of the axon segment is the key to the high efficiency of the propagation mechanism.
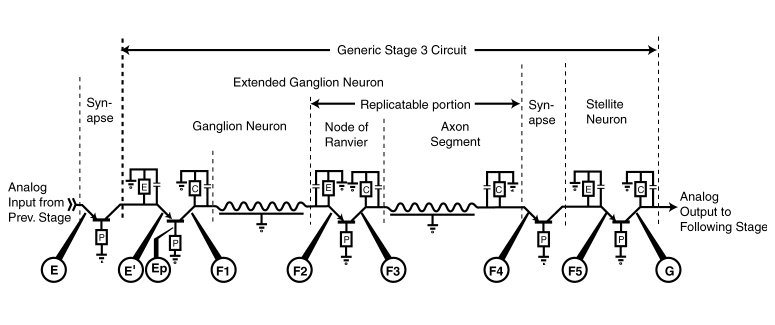
Each of the Activa are shown connected to a local ground terminal represented by the local external neural matrix.
Below the graphic are shown a series of electrolytic test poinits where signals can be readily sensed. The electrical signals acquired at these points clearly characterize the electrolytic signals being passed through the stage 3 circuits.
Berry & Pentreath have provided a set of waveforms to illustrate these signals. Unfortunately, they;
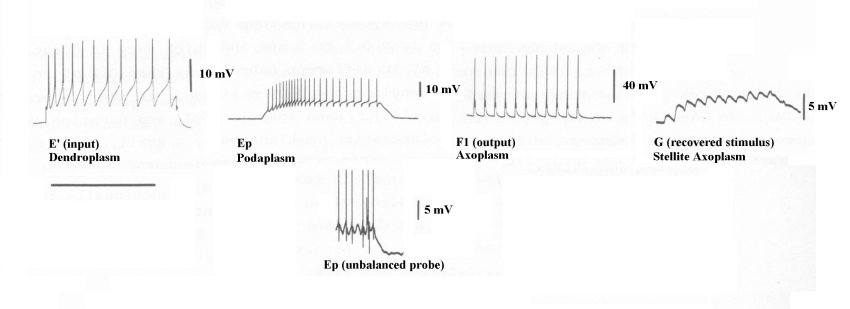
The time calibration bars are given as 2 sec for E', and 10 sec for Ep & F1. The voltage calibration bars are difficult to specify from the original citation.
Using the conventional wisdom of 1978, Berry & Pentreath asserted they probed "the soma" of their neuron. They did not seek to probe the electrolytically isolated dendroplasm, podaplasm or axoplasm (hillock) compartments within the soma of their neuron.
While no absolute voltages are given relative to the external neural matrix, the waveforms provide considerable information.
Berry described his test configuration only by "Conventional amplifying and stimulation equipment was used." A direct coupled oscilloscope is needed to show these waveforms properly. Otherwise, as here, their important DC bias level is lost and the AC waveforms generally exhibit misleading overshoot artifacts. Compare the waveform labeled Ep and the Ep waveform below it (at a differnt time scale) due to a poorly balanced probe. The negative spikes below the analog waveform are artifacts of the test configuration. Such artifacts are commonly found in the waveforms acquired in biological laboratories.
Go back to the next, second page of this subject set, neural code generation.
Go to the third page of this subject set, neural code decoding.
Return to the Neuron Research home page.
Fulton, J. (2010) Neuron and Neural System Processes. Signal Projection Chapter. http://neuronresearch.net/neuron/document.htm
Berry, M. & Penteath, V. (1978) The characterised dopamine neuron in Planorbis corneus In Osborne, N. ed. Biochemistry of Characterised Neurons. NY: Pergamon Press pg 89