The INTERVAL-DURATION RELATIONSHIP of the heart
Specific material extracted from
THE NEURON AND NEURAL SYSTEM:
by JAMES T. FULTON
INTRODUCTION
Last update: Activa™: See Citation Page
The heart operates largely independent of the rest of the neural system of the organism. The neural subsystem of the heart includes all of the functional stages of the main neural system. However, it exhibits one phenomenon not found elsewhere in the neural system.
The pulse stream generated by the sinoatrial (SA) node, and passed along the Purkinje bundles, resembles conventional action potentials, except the pulse rate is much lower than in other stage 3 action potentials (~100/minute versus ~100/second). To differentiate pulses of this character, they will be called "cardiac action potentials." The pulse width of these cardiac action potentials remains essentially constant with changes in heart beat rate due to the fixed character of the circuit elements forming the pulses.
The waveforms recorded from the main contractile cardiocytes typically exhibit a square pulse with a wide width derived from the cardiac action potentials at low rates of heart beat. Katz has provided nominal values for these parameters. The nominal contractile cardiocyte pulse width is given as 0.35 seconds when the heart operates at 75 beats/min (0.8 seconds total cycle length. However, a trained athlete can achieve a heart beat rate of 180 beats/min. (total cycle length of only 0.33 seconds. Clearly, the cardiocyte pulse duration must decrease as the heart beat rate increases. The conventional statement is (Katz, pg 385) "the interval-duration phenomenon allows the long diastolic interval to prolong the following action potential, and shortens an action potential that follows a short diastolic interval." However, this is not a cause and effect relationship, it is merely a restatement of the observed relationship between two phenomena.
The actual cause of the relationship is the limited fuel (nominally the amino acid, lysine) available to provide electrostenolytic power to the poditic terminal of the cardiocyte. This limitation relates to the poda impedance, RP, in the poditic path between the Activa and the electrostenolytic supply, Vps, as shown in the following circuit diagram.
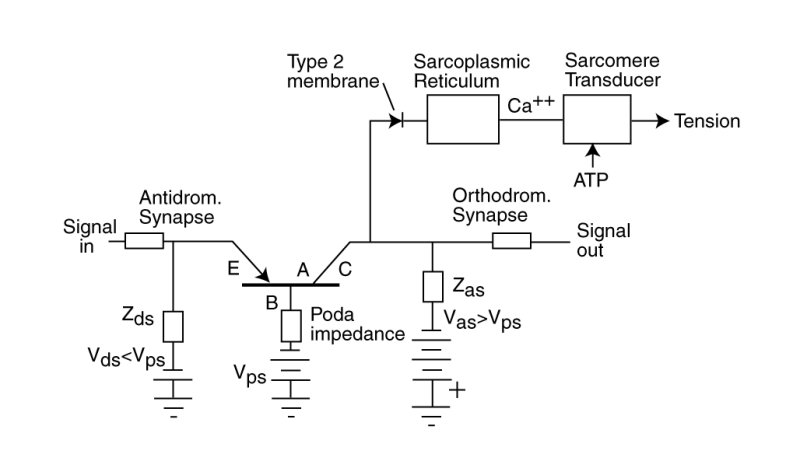
The poda impdance appears in both the dendrite-podite circuit loop and in the podite-axon circuit loop. In this position, it can act as an internal feedback element. Any change in the current in the podite-axon circuit will cause a voltage change across the poda impedance in the dendrite-podite circuit. The polarity of this voltage change is positive. The result is known as positive internal feedback.
Positive internal feedback in a contractile cardiocyte introduces a complex change in the pulse width at the axon terminal as describe in the previous web page. The primary effect is to shorten the duration of the axon waveform stimulating the sarcomere as the fuel becomes more limited and the poda impedance rises. This is the mechanism underlying the duration-interval relationship of the heart.
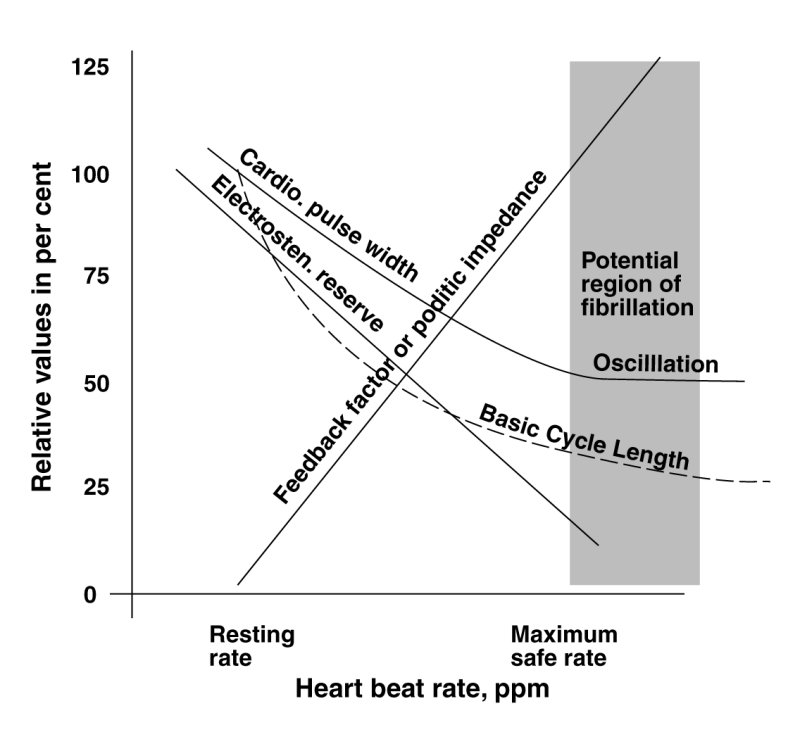
There is a danger in this process. If the feedback factor should exceed 1.0 (or 100% in the next figure), the neural circuit will go into free-running oscillation (at the individual cell level). This condition is known as fibrillation. If it should occur simultaneously in many adjacent cells, the condition is clinical fibrillation. Fibrillation is a serious condition if it relates to the ventricular muscle of the heart. It is less critical but debilitating if it relates to the atrial chambers of the heart.
As the heart beat rate increases, the shortened square pulses also exhibit secondary features as discussed on the previous web page. Details related to these features are available in Chapter 20 of the book accessed through the heart home page below.
The following figure combines the above discussion into one conceptual illustration. Beginning with the heart beat rate, it has a relatively narrow range in humans, nominally in the 60-70 beats per second range at rest and increasing to a maximum in the 150 to 200 beats per second at maximum. As the rate increases, the amount of fuel available locally to the cardiocytes per beat begins to fall. This fall is reflected in an increase in the poda impdeance, RP. The feedback factor increases in direct proportion to the poda impedance. This increase in the feedback factor shortens the duration of the axon waveform stimulating the sarcomeres as the heart beat rate rises and the heart beat interval falls, as documented by the duration-interval relationship.
As mentioned above, there is a danger that the feedback factor could exceed 1.0. At that point, the cardiocyte will go into free-running oscillation beyound the control of the hearts pacemaker apparatus. Fibrillation will be encountered, at first on a local (single cell) basis. However, if the demand on the heart is maintained, the fibrillation will become more widespread, Fibrillation is the asynchronous operation of the cells of the heart msucle. Heart pumping efficiency will fall, and debilitation or a serious ischemia (heart attack) can result.
Frequently, angina (the pain in the chest associated with a heart attack) will occur before the situation reaches the level of ischemia. However, angina is not a reputable precursor to difficulty.
Return to the Heart home page
Return to the Neural System home page