CARDIOCYTE (MYOCYTE) OF THE HEART
Specific material extracted from
THE NEURON AND NEURAL SYSTEM:
by JAMES T. FULTON
INTRODUCTION
Last update: Activa™: See Citation Page
The cytology of the cardiocytes (myocytes) of the heart
The contractile cells of the heart have traditionally been examined from a morphological perspective. Traditionally, they were called myocytes to indicate their fundamental character. The typical investigator was not conversant in the neurosciences and the appearance of electrical signals originating within the heart itself were appreciated but not totally understood.
This work has developed the fact that the major cells of the heart are of a unique functional form. Every functional cardiac cell incorporates both a neurological and a muscular capability. Thus, the cells are more properly described as neuro-mylo-cytes. Here the more compact form cardicytes will be used.
The following schematic figure illustrates the multiple functions occurring within a typical cardiocyte, and its conceptual derivation from a stem cell.
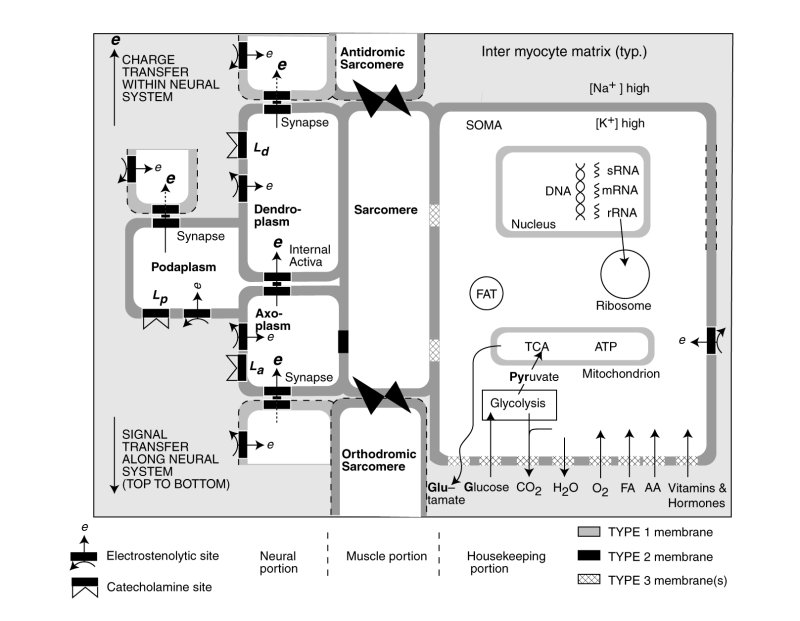
The nominal cardiocyte consists of three distinct functional activities, the contractile portion containing the sarcomere and sarcoplasmic reticulum shown in the center, the neural portion on the left associated with the electrical stimulation of the sarcomere and potentially the sarcoplasmic reticulum, and the housekeeping functions associated with the neucleus, mitochondria etc. shown on the right. The butterflies represent the intercalated disks connecting the sarcomere of adjacent cells structurally. The neural portion is shown both stimulating the contractile portion but also passing an electrolytic signal to the following cardicyte.
The bulk of the cardiocyte lemma is of type 1; it is impermeable to electrical charges and impermeable to ions (including the alkali and alkali earth ions. Significant parts of thelemma of the housekeeping portion is of type 3; they are collegially capable of passing a wide variety of chemicals as shown at the lower right. However, each class of chemicals is passed by a specifically modified section of type 3 lemma. In conformance with the electrostatic laws of physics and physical chemistry, chemicals pass through the lemma in neutral form, not as ions.
The lemma of the neural portion of the cardiocyte is shown as incorporating several areas of type 2 lemma optimized for supporting electrostatic processes and creating the electrical potentials within the neural portion. The synapses are also assembled from type 2 lemma. A variety of pharmaceuticals are known to affect heart operation. It is expected that some of these will be neuro-inhibitors interfering with the operation of the electrostenolytic processes. Some of these pharmaceuticals, such as the catecholines, may modulate the operation of the neural portion through other tailored sections of the lemma.
The wall between the axoplasm of the neural portion and the sarcomere of the contractile portion is type 2 lemma. It supports the transfer of the electrical potential of the axoplasm to the fluids of the contractile portion.
Each cardiocyte incorporates all of the housekeeping functions of a simple cell, all of the neurological functions of a neuron and all of the contractile functions of a skeletal or enteric muscle.
The following figure illustrates the cytological aspects of the cardiocyte with emphasis on its neurological characteristics.
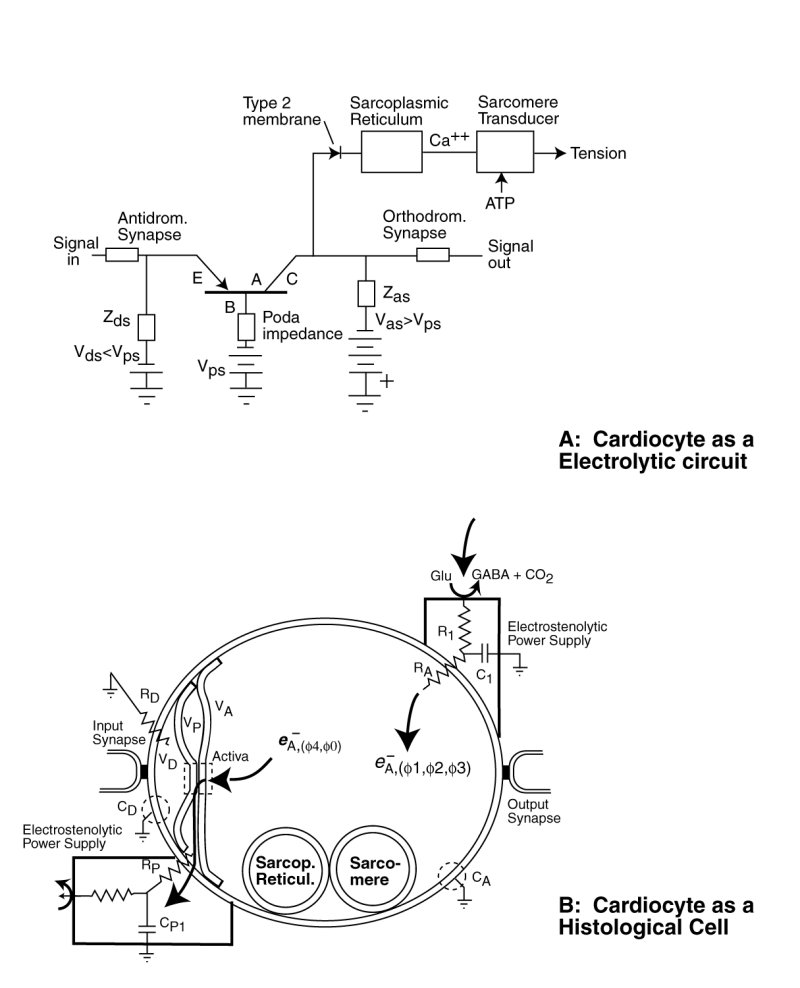
The neurological portion of the cardiocyte forms a three terminal electrical circuit centered on the three terminal Activa. The neurological portion of the cardiocyte consists of three chambers, associated with its dendritic, poditic and axonal portions. It is the type 2 lemma of the dendritic and axonal portions of the cell that form the active electrolytic semiconductor device, the Activa by sandwiching a thin layer of crystalline water between them. Water is crystalline at biological temperatures when confined within a space of less than 100 Angrstom.
Under the Electrolytic Theory of the Neuron, no alkali or alkali earth ions pass through the lemma of the neural portion of the cardiocyte . The lemma forms an impermeable wall to these free ions. Such a barrier negates the application of the Nernst Theory of electrical potentials between solutions separated by a permeable membrane.
Electrical charge enters the axolemma through the electrostenolytic process at upper right. The charge leaves the axolemma via the Activa and the podalemma at the lower left. While it is common to describe the fluid in the axolemma as the axoplasm, and that in the podalemma as the podaplasm, these fluids play no role in the signaling operation of the neuron.
The first-order waveforms of the cardiocytes (myocytes) of the heart
The literature contains a large number of waveforms recorded from cardiocytes of the heart. They can be separated into two major classes; those associated with the Sinus (S)node and Atrioventricular (AV) node, and those associated with the primary contractile cardiocytes. Those associated with the S and AV nodes are typical waveforms produced by free-running or driven relaxation oscillators. The shape of the waveform is typical of stage 3 neurons throughout the neural system. The waveforms associated with the contractile cardiocytes exhibit much more variety, primarily varying as a function of stress on the system (whether in-vivo or in-vitro), but also showing variety due to the stimulation conditions employed by investigators in-vitro.
The waveforms of the contractile cardiocytes can best be divided into two orthogonal groups; those associated with the negative electrostenolytic power supply of the axon, and those associated with the positive electrostenolytic power supply of the poditic terminal.
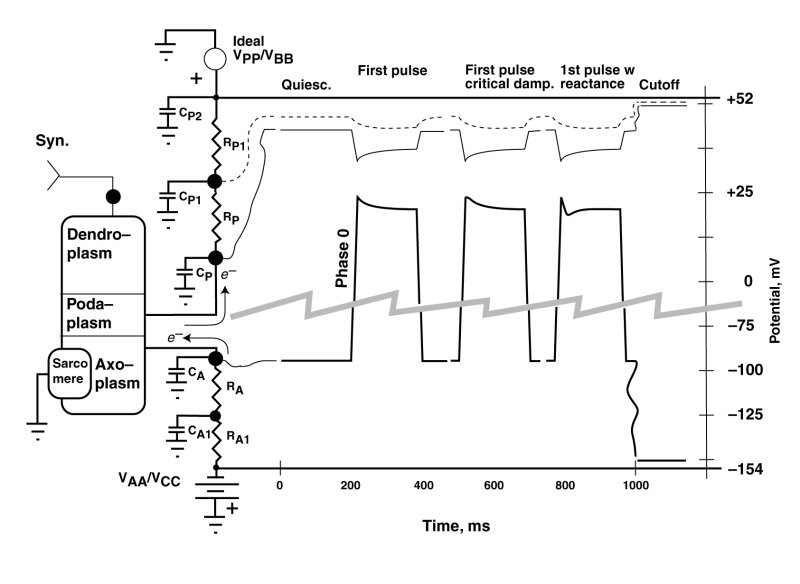
The following figure shows three waveforms resulting from changes in the effective impedance of the positive electrostenolytic power source, VPP, connected to the podaplasm of the cardiocyte. This impedance is a principle element in the internal feedback of the Activa circuit within the cardiocyte.
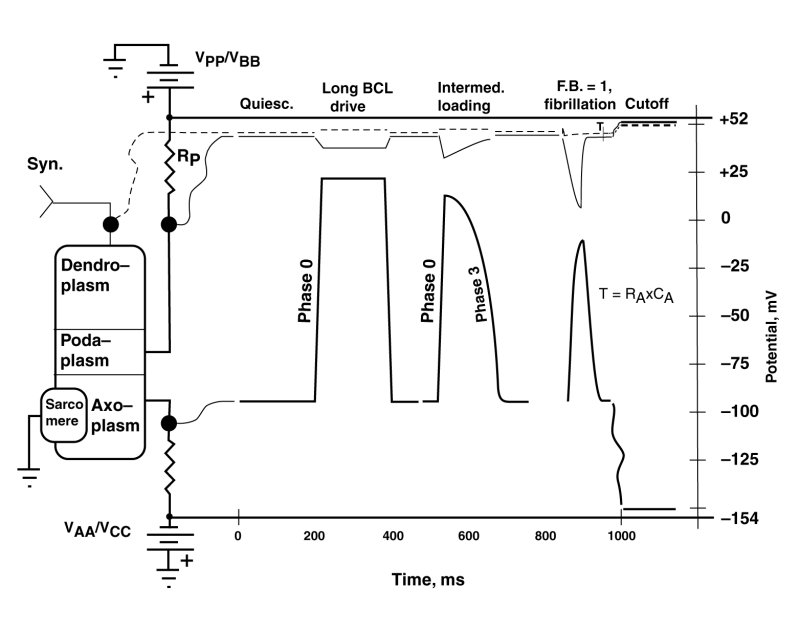
The figure is called a serape in electrical engineering usage. The right portion of the serape shows multiple waveforms simultaneously for different locations in the electrolytic circuit of interest shown on the left. The circuit on the left shows the typical cardiocyte. Its internal Activa is not shown explicitly. The squiggly lines connect the test points of the cardiocyte circuit with the specific waveforms on the right.
In this figure, three distinct waveforms are shown that are associated with the axoplasm of the cardiocyte. They are accompanied by the simultaneous dendroplasm and podaplasm waveforms. The waveforms shown are quasi-static or first-order in that the transients to be introduced in the next figure are not shown.
The condition labeled quiescent illustrates the potentials usually associated with contractile cardiocytes in the absence of stimulation.
It is important in the following discussion to differentiate between the stimulation of the dendroplasm of a cardiocyte by natural means in-vivo, and artificial stimulation typically by introducing electrical charge directly into the axoplasm of the cardiocyte in-vitro. The later means of stimulation is described as parametric stimulation because it does not stimulate the cardiocyte at its normal input terminal.
The first set of waveforms, labeled long basic cycle length (BCL) drive, shows the typical waveform encountered under low pulse rate conditions for the species of interest. It is the waveform typically encountered in response to a first parametric stimulus pulse in a series, or for subsequent pulses applied parametrically with long intervals between pulses (low pulse rates) in-vitro. The impedance, RP is minimal in this situation. The leading edge (phase 0) of the waveform is quite straight and rises rapidly. The trailing edge (phase 3) is of similar form. The same shape waveform is typically encountered in-vitro in the absence of any pharmaceuticals. The axoplasm waveform is seen to be an inverted version of the podaplasm potential. This is true in all three cases. They are in fact given by the equation--(the dendroplasm potential minus the podaplasm potential) times an amplification factor. RP.
The second set of waveforms shows a leading edge (phase 0) similar to the previous example but a narrowing of the axoplasm waveform and a distinct roll-off during phase 3. This change is due to an increased value for the impedance RP which determines the amount of internal feedback present in this circuit. The precise shape of both the axoplasm and podaplasm waveforms is determined by the specific feedback factor (<1.0) present.
The third set of waveforms, for a feedback factor (F.B.) of 1.0, shows a leading edge (phase 0) similar to the previous examples; however, the trailing edge has changed significantly. It now exhibits a descending edge (phase 3) given by an exponential with a time constant defined by the product of axoplasm capacitance, CA, and the axoplasm electrostenolytic supply impedance, RA. This change is entirely due to the feedback factor reaching or exceeding the value of 1.0. The circuit is now performing as a relaxation oscillator. The waveform is identical to that of the S node and AV node relaxtation oscillators; and in fact, it is identical to that associated with any stage 3 neuron of the main neural system.
The second and third sets of waveforms are controlled by the value of the impedance RP. This value is determined naturally by the ability of the extracardiocyte matrix to provide lysine to the electrostenolytic process and remove the waste product, isoleucine, from the area. The value can obviously be impacted by any pharmaceutical that inhibits the availability of lysine to the process or inhibits the removal of isoleucine from the process.
The mechanism behind the interval-duration phenomenon
The above change in effective podaplasm impedance, RP, and resultant change in the internal feedback factor is the mechanism underlying the interval-duration phenomenon documented by the electrophysiologists. In this phenomenon, an unusual change occurs. Unlike most man-made pulse generators and amplifiers, the pulse width remains constant regardless of pulse repitition rate. In the cardiocyte, the pulse width decreases in proportion to the pulse basic cycle length (BCL), or inversely with the pulse rate.
The second-order waveforms of the cardiocytes (myocytes) of the heart
The following figure shows three waveforms resulting from changes in the effective impedance of the negative electrostenolytic power source, VAA, connected to the axoplasm of the cardiocyte. This impedance is a network consisting of the individual impedances, RA, CA1 and RA1 feeding electronic current to the axolemma impedance, CA.
The vertical scale has been interrupted and expanded in this serape to provide more detail. In this example, the value of the podaplasm impedance, RP, and the resultant feedback factor, are always low. The primary features of interest are those following the rapid rise of the waveform (phase 0). These have historically been labeled aa overshoots by electrophysiologists. However, this term is technically questionable as discussed below. Under natural conditions, it is unusual to encounter such an overshoot. These features are typically encountered in-vitro under abnormal pulse conditions, including an initial parametric stimulation pulse after a long period of quiescents.
After a period of quiescence, the potential on the capacitor, CA, will be at its most negative. The Activa within the cardiocyte is in its operating range, and the most negative potential is a balance between the electron current (e--) leaving the capacitor, CA, via the Activa, and the electron current arriving at the capacitor from the electrstenolytic supply, VAA.
-
An overshoot is typically used to describe a conceptual feature of a waveform where the waveform passes a target value during a change in state and then gradually returns to the target value. An overshoot typically involves a positive reactance in a circuit. In the case at hand, the leading edge (phase 0) actually proceeds directly to its target value, represented by the most maximum positive potential on capacitor CA. This is achieved by the Activa withdrawing electrons from the axoplasm rapidly. However, this potential is not sustainable because, the electrostenolytic supply immediately tries to re-establish a more negative potential on capacitor CA with a time constant given by the product of the capacitance, CA, and the resitive component of RA. The result is an exponential decay during phase 1 from the peak value of potential on CA to a sustainable value as shown. This is a decay phenomenon and not an overshoot.
The shape of the waveform following the peak due to phase 0 is variable, depending on the complexity and relative circuit values of the impedances between the axoplasm and the negative electrolytic suppply, VAA. These phase 1 waveforms can take three forms. The first is a simple exponential as discussed above and described by a first-order differential equation. The phase 1 waveform leaves phase 0 with a negative slope. The second is an overdamped waveform departing from the phase 0 waveform horizontally before adopting an exponential-like form. It is the fresult of an overdampled second-order differential equation. The third form of the waveform can generate a dip after leaving phase 0 with a negative slope and then rising to the sustainable level as shown on the right. This form is due to a second-order less damped differential equation. The result is a shape that has been described as a notch and dome, with the notch being associated with phase 1 and the dome being associated with a separate phase 2. In fact, only a single mechanism produces the notch and dome phenomenon. It is the same mechanism and same exposine function response encountered in the adaptation process in vision.
Return to Heart main page